- Japan
- /
- Interactive Media and Services
- /
- TSE:7069
Investors Still Aren't Entirely Convinced By CyberBuzz, Inc.'s (TSE:7069) Revenues Despite 28% Price Jump
Those holding CyberBuzz, Inc. (TSE:7069) shares would be relieved that the share price has rebounded 28% in the last thirty days, but it needs to keep going to repair the recent damage it has caused to investor portfolios. While recent buyers may be laughing, long-term holders might not be as pleased since the recent gain only brings the stock back to where it started a year ago.
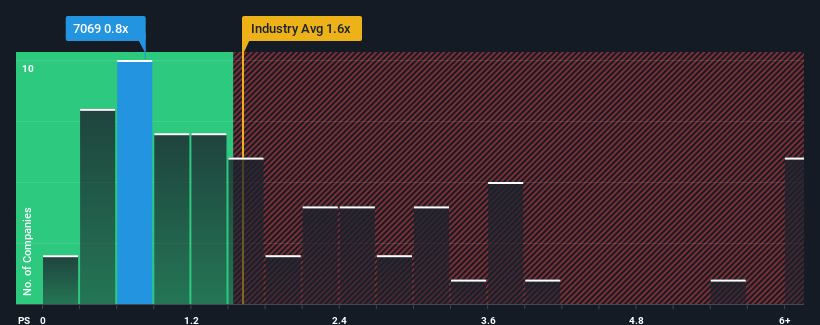
Even after such a large jump in price, CyberBuzz may still be sending buy signals at present with its price-to-sales (or "P/S") ratio of 0.8x, considering almost half of all companies in the Interactive Media and Services industry in Japan have P/S ratios greater than 1.6x and even P/S higher than 4x aren't out of the ordinary. However, the P/S might be low for a reason and it requires further investigation to determine if it's justified.
View our latest analysis for CyberBuzz

What Does CyberBuzz's P/S Mean For Shareholders?
Recent times have been advantageous for CyberBuzz as its revenues have been rising faster than most other companies. One possibility is that the P/S ratio is low because investors think this strong revenue performance might be less impressive moving forward. If the company manages to stay the course, then investors should be rewarded with a share price that matches its revenue figures.
Keen to find out how analysts think CyberBuzz's future stacks up against the industry? In that case, our free report is a great place to start.Is There Any Revenue Growth Forecasted For CyberBuzz?
CyberBuzz's P/S ratio would be typical for a company that's only expected to deliver limited growth, and importantly, perform worse than the industry.
Retrospectively, the last year delivered an exceptional 40% gain to the company's top line. Pleasingly, revenue has also lifted 143% in aggregate from three years ago, thanks to the last 12 months of growth. Accordingly, shareholders would have definitely welcomed those medium-term rates of revenue growth.
Shifting to the future, estimates from the sole analyst covering the company suggest revenue should grow by 18% per year over the next three years. Meanwhile, the rest of the industry is forecast to only expand by 7.7% per annum, which is noticeably less attractive.
With this information, we find it odd that CyberBuzz is trading at a P/S lower than the industry. It looks like most investors are not convinced at all that the company can achieve future growth expectations.
The Bottom Line On CyberBuzz's P/S
Despite CyberBuzz's share price climbing recently, its P/S still lags most other companies. It's argued the price-to-sales ratio is an inferior measure of value within certain industries, but it can be a powerful business sentiment indicator.
A look at CyberBuzz's revenues reveals that, despite glowing future growth forecasts, its P/S is much lower than we'd expect. The reason for this depressed P/S could potentially be found in the risks the market is pricing in. At least price risks look to be very low, but investors seem to think future revenues could see a lot of volatility.
Don't forget that there may be other risks. For instance, we've identified 2 warning signs for CyberBuzz (1 is potentially serious) you should be aware of.
If strong companies turning a profit tickle your fancy, then you'll want to check out this free list of interesting companies that trade on a low P/E (but have proven they can grow earnings).
New: AI Stock Screener & Alerts
Our new AI Stock Screener scans the market every day to uncover opportunities.
• Dividend Powerhouses (3%+ Yield)
• Undervalued Small Caps with Insider Buying
• High growth Tech and AI Companies
Or build your own from over 50 metrics.
Have feedback on this article? Concerned about the content? Get in touch with us directly. Alternatively, email editorial-team (at) simplywallst.com.
This article by Simply Wall St is general in nature. We provide commentary based on historical data and analyst forecasts only using an unbiased methodology and our articles are not intended to be financial advice. It does not constitute a recommendation to buy or sell any stock, and does not take account of your objectives, or your financial situation. We aim to bring you long-term focused analysis driven by fundamental data. Note that our analysis may not factor in the latest price-sensitive company announcements or qualitative material. Simply Wall St has no position in any stocks mentioned.
About TSE:7069
Undervalued with excellent balance sheet.
Market Insights
Weekly Picks


Crazy Undervalued 42 Baggers Silver Play (Active & Running Mine)


Fiducian: Compliance Clouds or Value Opportunity?

Willamette Valley Vineyards (WVVI): Not-So-Great Value
Recently Updated Narratives

Moderation and Stabilisation: HOLD: Fair Price based on a 4-year Cycle is $12.08


Positioned globally, partnered locally


When will fraudsters be investigated in depth. Fraud was ongoing in France too.
Popular Narratives


MicroVision will explode future revenue by 380.37% with a vision towards success


NVDA: Expanding AI Demand Will Drive Major Data Center Investments Through 2026


