
Advertisement
- Japan
- /
- Entertainment
- /
- TSE:6879
Improved Revenues Required Before IMAGICA GROUP Inc. (TSE:6879) Stock's 55% Jump Looks Justified

IMAGICA GROUP Inc. (TSE:6879) shareholders have had their patience rewarded with a 55% share price jump in the last month. Looking back a bit further, it's encouraging to see the stock is up 49% in the last year.
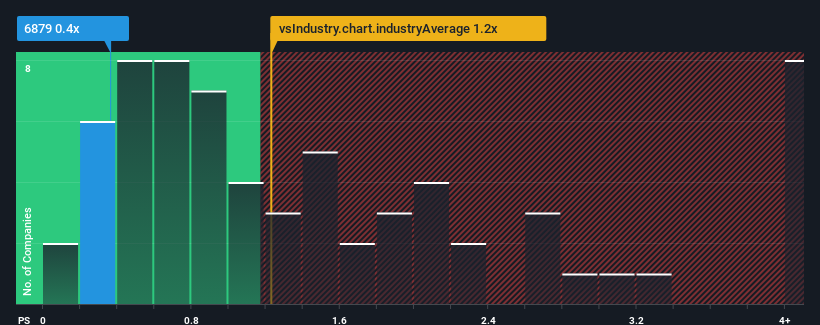
Although its price has surged higher, it would still be understandable if you think IMAGICA GROUP is a stock with good investment prospects with a price-to-sales ratios (or "P/S") of 0.4x, considering almost half the companies in Japan's Entertainment industry have P/S ratios above 1.2x. Nonetheless, we'd need to dig a little deeper to determine if there is a rational basis for the reduced P/S.
View our latest analysis for IMAGICA GROUP
What Does IMAGICA GROUP's P/S Mean For Shareholders?
IMAGICA GROUP has been doing a reasonable job lately as its revenue hasn't declined as much as most other companies. It might be that many expect the comparatively superior revenue performance to degrade substantially, which has repressed the P/S. If you still like the company, you'd want its revenue trajectory to turn around before making any decisions. But at the very least, you'd be hoping that revenue doesn't fall off a cliff completely if your plan is to pick up some stock while it's out of favour.
Want the full picture on analyst estimates for the company? Then our free report on IMAGICA GROUP will help you uncover what's on the horizon.Do Revenue Forecasts Match The Low P/S Ratio?
The only time you'd be truly comfortable seeing a P/S as low as IMAGICA GROUP's is when the company's growth is on track to lag the industry.
Retrospectively, the last year delivered a frustrating 2.8% decrease to the company's top line. That put a dampener on the good run it was having over the longer-term as its three-year revenue growth is still a noteworthy 21% in total. So we can start by confirming that the company has generally done a good job of growing revenue over that time, even though it had some hiccups along the way.
Shifting to the future, estimates from the two analysts covering the company suggest revenue growth is heading into negative territory, declining 1.7% over the next year. Meanwhile, the broader industry is forecast to expand by 43%, which paints a poor picture.
With this in consideration, we find it intriguing that IMAGICA GROUP's P/S is closely matching its industry peers. However, shrinking revenues are unlikely to lead to a stable P/S over the longer term. There's potential for the P/S to fall to even lower levels if the company doesn't improve its top-line growth.
The Key Takeaway
The latest share price surge wasn't enough to lift IMAGICA GROUP's P/S close to the industry median. Typically, we'd caution against reading too much into price-to-sales ratios when settling on investment decisions, though it can reveal plenty about what other market participants think about the company.
It's clear to see that IMAGICA GROUP maintains its low P/S on the weakness of its forecast for sliding revenue, as expected. Right now shareholders are accepting the low P/S as they concede future revenue probably won't provide any pleasant surprises. It's hard to see the share price rising strongly in the near future under these circumstances.
You always need to take note of risks, for example - IMAGICA GROUP has 2 warning signs we think you should be aware of.
If companies with solid past earnings growth is up your alley, you may wish to see this free collection of other companies with strong earnings growth and low P/E ratios.
New: AI Stock Screener & Alerts
Our new AI Stock Screener scans the market every day to uncover opportunities.
• Dividend Powerhouses (3%+ Yield)
• Undervalued Small Caps with Insider Buying
• High growth Tech and AI Companies
Or build your own from over 50 metrics.
Have feedback on this article? Concerned about the content? Get in touch with us directly. Alternatively, email editorial-team (at) simplywallst.com.
This article by Simply Wall St is general in nature. We provide commentary based on historical data and analyst forecasts only using an unbiased methodology and our articles are not intended to be financial advice. It does not constitute a recommendation to buy or sell any stock, and does not take account of your objectives, or your financial situation. We aim to bring you long-term focused analysis driven by fundamental data. Note that our analysis may not factor in the latest price-sensitive company announcements or qualitative material. Simply Wall St has no position in any stocks mentioned.
About TSE:6879
Flawless balance sheet and fair value.
Market Insights

Advertisement
Community Narratives

Apple: A Dying Star with an Overpriced Valuation
Fair Value US$177.34|19.2% overvalued
IN
Community Contributor
Avino a case for USD$20 per share within 5 years (assuming $3,500 gold, $100 silver and $4 copper).
Fair Value CA$26.79|86.0% undervalued
AG
Community Contributor
Riding the Defense Boom RENK Sees Revenue Climb at 15% CAGR by FY 2029
Fair Value €69.87|20.5% undervalued
CH
Community Contributor