
Advertisement

Howard Marks put it nicely when he said that, rather than worrying about share price volatility, 'The possibility of permanent loss is the risk I worry about... and every practical investor I know worries about.' When we think about how risky a company is, we always like to look at its use of debt, since debt overload can lead to ruin. We note that Rentracks CO.,LTD. (TSE:6045) does have debt on its balance sheet. But is this debt a concern to shareholders?
What Risk Does Debt Bring?
Debt assists a business until the business has trouble paying it off, either with new capital or with free cash flow. If things get really bad, the lenders can take control of the business. While that is not too common, we often do see indebted companies permanently diluting shareholders because lenders force them to raise capital at a distressed price. Having said that, the most common situation is where a company manages its debt reasonably well - and to its own advantage. When we think about a company's use of debt, we first look at cash and debt together.
View our latest analysis for RentracksLTD
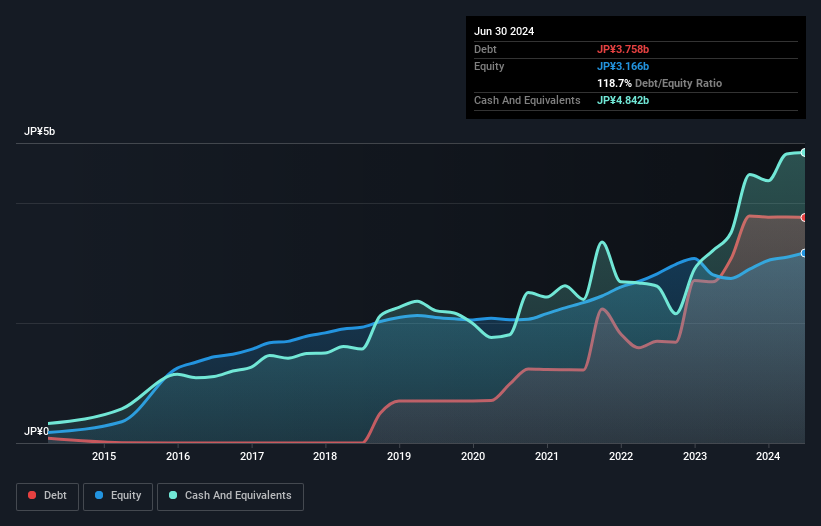
What Is RentracksLTD's Net Debt?
The image below, which you can click on for greater detail, shows that at June 2024 RentracksLTD had debt of JP¥3.76b, up from JP¥3.07b in one year. But on the other hand it also has JP¥4.84b in cash, leading to a JP¥1.08b net cash position.
A Look At RentracksLTD's Liabilities
The latest balance sheet data shows that RentracksLTD had liabilities of JP¥6.10b due within a year, and liabilities of JP¥236.0m falling due after that. Offsetting this, it had JP¥4.84b in cash and JP¥3.27b in receivables that were due within 12 months. So it actually has JP¥1.77b more liquid assets than total liabilities.
This luscious liquidity implies that RentracksLTD's balance sheet is sturdy like a giant sequoia tree. Having regard to this fact, we think its balance sheet is as strong as an ox. Simply put, the fact that RentracksLTD has more cash than debt is arguably a good indication that it can manage its debt safely.
Fortunately, RentracksLTD grew its EBIT by 6.9% in the last year, making that debt load look even more manageable. The balance sheet is clearly the area to focus on when you are analysing debt. But it is RentracksLTD's earnings that will influence how the balance sheet holds up in the future. So when considering debt, it's definitely worth looking at the earnings trend. Click here for an interactive snapshot.
Finally, while the tax-man may adore accounting profits, lenders only accept cold hard cash. While RentracksLTD has net cash on its balance sheet, it's still worth taking a look at its ability to convert earnings before interest and tax (EBIT) to free cash flow, to help us understand how quickly it is building (or eroding) that cash balance. Over the last three years, RentracksLTD reported free cash flow worth 13% of its EBIT, which is really quite low. For us, cash conversion that low sparks a little paranoia about is ability to extinguish debt.
Summing Up
While it is always sensible to investigate a company's debt, in this case RentracksLTD has JP¥1.08b in net cash and a decent-looking balance sheet. On top of that, it increased its EBIT by 6.9% in the last twelve months. So is RentracksLTD's debt a risk? It doesn't seem so to us. When analysing debt levels, the balance sheet is the obvious place to start. However, not all investment risk resides within the balance sheet - far from it. For example, we've discovered 3 warning signs for RentracksLTD that you should be aware of before investing here.
If you're interested in investing in businesses that can grow profits without the burden of debt, then check out this free list of growing businesses that have net cash on the balance sheet.
New: AI Stock Screener & Alerts
Our new AI Stock Screener scans the market every day to uncover opportunities.
• Dividend Powerhouses (3%+ Yield)
• Undervalued Small Caps with Insider Buying
• High growth Tech and AI Companies
Or build your own from over 50 metrics.
Have feedback on this article? Concerned about the content? Get in touch with us directly. Alternatively, email editorial-team (at) simplywallst.com.
This article by Simply Wall St is general in nature. We provide commentary based on historical data and analyst forecasts only using an unbiased methodology and our articles are not intended to be financial advice. It does not constitute a recommendation to buy or sell any stock, and does not take account of your objectives, or your financial situation. We aim to bring you long-term focused analysis driven by fundamental data. Note that our analysis may not factor in the latest price-sensitive company announcements or qualitative material. Simply Wall St has no position in any stocks mentioned.
About TSE:6045
RentracksLTD
Offers WEB consulting and Internet media services in Japan and internationally.
Solid track record with excellent balance sheet.
Market Insights

Advertisement
Community Narratives
The Most Undervalued of the Magnificent 7
Fair Value US$237.43|36.3% undervalued
IN
Community Contributor
PVA TePla's New Strategy Aims for 22% Revenue Growth in Semiconductor Recovery
Fair Value €19.19|20.8% undervalued
MI
Community Contributor