- Japan
- /
- Entertainment
- /
- TSE:3793
Positive Sentiment Still Eludes Drecom Co.,Ltd. (TSE:3793) Following 33% Share Price Slump

Unfortunately for some shareholders, the Drecom Co.,Ltd. (TSE:3793) share price has dived 33% in the last thirty days, prolonging recent pain. For any long-term shareholders, the last month ends a year to forget by locking in a 60% share price decline.
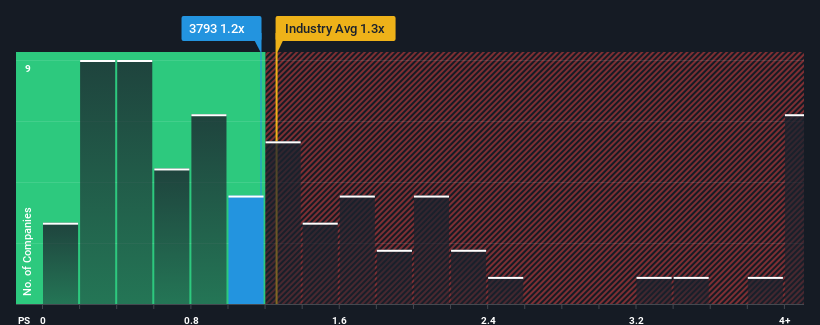
In spite of the heavy fall in price, there still wouldn't be many who think DrecomLtd's price-to-sales (or "P/S") ratio of 1.2x is worth a mention when the median P/S in Japan's Entertainment industry is similar at about 1.3x. Although, it's not wise to simply ignore the P/S without explanation as investors may be disregarding a distinct opportunity or a costly mistake.
See our latest analysis for DrecomLtd
What Does DrecomLtd's Recent Performance Look Like?
Recent times have been pleasing for DrecomLtd as its revenue has risen in spite of the industry's average revenue going into reverse. Perhaps the market is expecting its current strong performance to taper off in accordance to the rest of the industry, which has kept the P/S contained. If you like the company, you'd be hoping this isn't the case so that you could potentially pick up some stock while it's not quite in favour.
Want the full picture on analyst estimates for the company? Then our free report on DrecomLtd will help you uncover what's on the horizon.Do Revenue Forecasts Match The P/S Ratio?
The only time you'd be comfortable seeing a P/S like DrecomLtd's is when the company's growth is tracking the industry closely.
If we review the last year of revenue growth, the company posted a worthy increase of 2.8%. However, this wasn't enough as the latest three year period has seen an unpleasant 3.9% overall drop in revenue. So unfortunately, we have to acknowledge that the company has not done a great job of growing revenue over that time.
Shifting to the future, estimates from the lone analyst covering the company suggest revenue should grow by 76% over the next year. With the industry only predicted to deliver 25%, the company is positioned for a stronger revenue result.
With this information, we find it interesting that DrecomLtd is trading at a fairly similar P/S compared to the industry. Apparently some shareholders are skeptical of the forecasts and have been accepting lower selling prices.
The Final Word
With its share price dropping off a cliff, the P/S for DrecomLtd looks to be in line with the rest of the Entertainment industry. Generally, our preference is to limit the use of the price-to-sales ratio to establishing what the market thinks about the overall health of a company.
Looking at DrecomLtd's analyst forecasts revealed that its superior revenue outlook isn't giving the boost to its P/S that we would've expected. When we see a strong revenue outlook, with growth outpacing the industry, we can only assume potential uncertainty around these figures are what might be placing slight pressure on the P/S ratio. This uncertainty seems to be reflected in the share price which, while stable, could be higher given the revenue forecasts.
It's always necessary to consider the ever-present spectre of investment risk. We've identified 2 warning signs with DrecomLtd (at least 1 which is a bit concerning), and understanding them should be part of your investment process.
Of course, profitable companies with a history of great earnings growth are generally safer bets. So you may wish to see this free collection of other companies that have reasonable P/E ratios and have grown earnings strongly.
Mobile Infrastructure for Defense and Disaster
The next wave in robotics isn't humanoid. Its fully autonomous towers delivering 5G, ISR, and radar in under 30 minutes, anywhere.
Get the investor briefing before the next round of contracts
Sponsored On Behalf of CiTechNew: Manage All Your Stock Portfolios in One Place
We've created the ultimate portfolio companion for stock investors, and it's free.
• Connect an unlimited number of Portfolios and see your total in one currency
• Be alerted to new Warning Signs or Risks via email or mobile
• Track the Fair Value of your stocks
Have feedback on this article? Concerned about the content? Get in touch with us directly. Alternatively, email editorial-team (at) simplywallst.com.
This article by Simply Wall St is general in nature. We provide commentary based on historical data and analyst forecasts only using an unbiased methodology and our articles are not intended to be financial advice. It does not constitute a recommendation to buy or sell any stock, and does not take account of your objectives, or your financial situation. We aim to bring you long-term focused analysis driven by fundamental data. Note that our analysis may not factor in the latest price-sensitive company announcements or qualitative material. Simply Wall St has no position in any stocks mentioned.
About TSE:3793
Reasonable growth potential with adequate balance sheet.
Market Insights

Weekly Picks

Early mover in a fast growing industry. Likely to experience share price volatility as they scale


A case for CA$31.80 (undiluted), aka 8,616% upside from CA$0.37 (an 86 bagger!).


Moderation and Stabilisation: HOLD: Fair Price based on a 4-year Cycle is $12.08
Recently Updated Narratives

Amazon: Why the World’s Biggest Platform Still Runs on Invisible Economics

Sunrun Stock: When the Energy Transition Collides With the Cost of Capital

Salesforce Stock: AI-Fueled Growth Is Real — But Can Margins Stay This Strong?
Popular Narratives


MicroVision will explode future revenue by 380.37% with a vision towards success


Crazy Undervalued 42 Baggers Silver Play (Active & Running Mine)


