- Japan
- /
- Entertainment
- /
- TSE:3793
Drecom Co.,Ltd. (TSE:3793) Stocks Shoot Up 32% But Its P/S Still Looks Reasonable

Despite an already strong run, Drecom Co.,Ltd. (TSE:3793) shares have been powering on, with a gain of 32% in the last thirty days. The last 30 days bring the annual gain to a very sharp 48%.
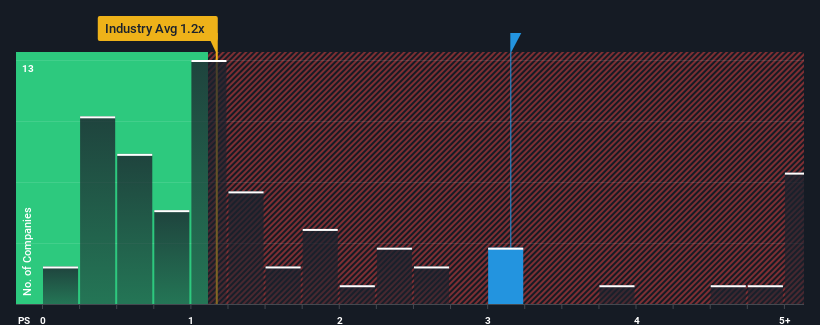
Following the firm bounce in price, given close to half the companies operating in Japan's Entertainment industry have price-to-sales ratios (or "P/S") below 1.2x, you may consider DrecomLtd as a stock to potentially avoid with its 3.1x P/S ratio. Nonetheless, we'd need to dig a little deeper to determine if there is a rational basis for the elevated P/S.
View our latest analysis for DrecomLtd

What Does DrecomLtd's P/S Mean For Shareholders?
DrecomLtd could be doing better as its revenue has been going backwards lately while most other companies have been seeing positive revenue growth. It might be that many expect the dour revenue performance to recover substantially, which has kept the P/S from collapsing. You'd really hope so, otherwise you're paying a pretty hefty price for no particular reason.
Want the full picture on analyst estimates for the company? Then our free report on DrecomLtd will help you uncover what's on the horizon.Is There Enough Revenue Growth Forecasted For DrecomLtd?
DrecomLtd's P/S ratio would be typical for a company that's expected to deliver solid growth, and importantly, perform better than the industry.
Taking a look back first, the company's revenue growth last year wasn't something to get excited about as it posted a disappointing decline of 7.1%. This means it has also seen a slide in revenue over the longer-term as revenue is down 18% in total over the last three years. Accordingly, shareholders would have felt downbeat about the medium-term rates of revenue growth.
Turning to the outlook, the next year should demonstrate the company's robustness, generating growth of 11% as estimated by the dual analysts watching the company. That would be an excellent outcome when the industry is expected to decline by 0.1%.
In light of this, it's understandable that DrecomLtd's P/S sits above the majority of other companies. At this time, shareholders aren't keen to offload something that is potentially eyeing a much more prosperous future.
What Does DrecomLtd's P/S Mean For Investors?
DrecomLtd shares have taken a big step in a northerly direction, but its P/S is elevated as a result. Generally, our preference is to limit the use of the price-to-sales ratio to establishing what the market thinks about the overall health of a company.
As we suspected, our examination of DrecomLtd's analyst forecasts revealed that its superior revenue outlook against a shaky industry is contributing to its high P/S. Right now shareholders are comfortable with the P/S as they are quite confident future revenues aren't under threat. We still remain cautious about the company's ability to keep swimming against the current of the broader industry turmoil. Assuming the company's outlook remains unchanged, the share price is likely to be supported by prospective buyers.
Don't forget that there may be other risks. For instance, we've identified 3 warning signs for DrecomLtd that you should be aware of.
If strong companies turning a profit tickle your fancy, then you'll want to check out this free list of interesting companies that trade on a low P/E (but have proven they can grow earnings).
New: Manage All Your Stock Portfolios in One Place
We've created the ultimate portfolio companion for stock investors, and it's free.
• Connect an unlimited number of Portfolios and see your total in one currency
• Be alerted to new Warning Signs or Risks via email or mobile
• Track the Fair Value of your stocks
Have feedback on this article? Concerned about the content? Get in touch with us directly. Alternatively, email editorial-team (at) simplywallst.com.
This article by Simply Wall St is general in nature. We provide commentary based on historical data and analyst forecasts only using an unbiased methodology and our articles are not intended to be financial advice. It does not constitute a recommendation to buy or sell any stock, and does not take account of your objectives, or your financial situation. We aim to bring you long-term focused analysis driven by fundamental data. Note that our analysis may not factor in the latest price-sensitive company announcements or qualitative material. Simply Wall St has no position in any stocks mentioned.
About TSE:3793
Reasonable growth potential and fair value.
Market Insights
Community Narratives


