Advertisement
- Japan
- /
- Entertainment
- /
- TSE:3659
Is Now the Moment to Consider NEXON After Its 48% Gain in 2025?

Simply Wall St
Reviewed by Simply Wall St
If you have ever looked at the NEXON stock ticker and wondered, “Is now my moment?” you are not alone. NEXON has been one of those companies that quietly, yet consistently, moves the needle for long-term investors. Just look at the numbers: the stock has racked up an impressive 48.0% gain year-to-date and is up nearly 28.7% over the last twelve months. Even as markets have shifted and new headlines made the rounds, NEXON has mostly kept its footing, with a gentle 0.6% dip in the last week and a 4.6% rise over the past month. That kind of resilience is worth a second glance, especially for those evaluating where the next growth story lies.
Some of this stability comes as broader market optimism around tech and gaming has grown, nudged along by steadily increasing investor confidence. Longer-term, NEXON's smooth 33.8% 3-year and 26.9% 5-year returns highlight a company that knows how to weather both hype cycles and the dry spells in between. The real question is whether the current share price has gotten ahead of itself, or if there is still attractive value yet to be uncovered.
To help answer that, we will get into NEXON's valuation score. Out of six key checks for undervaluation, NEXON passes two, earning it a value score of 2. That is not wildly cheap, but it may still catch the eye of savvy investors looking for a balance of growth and reasonable pricing. In the next section, let us break down what goes into those valuation methods, and keep an eye out, because there is an even more insightful way to think about value that we will share at the end of this article.
NEXON scores just 2/6 on our valuation checks. See what other red flags we found in the full valuation breakdown.Approach 1: NEXON Discounted Cash Flow (DCF) Analysis
The Discounted Cash Flow (DCF) model estimates a company's value by forecasting its future cash flows and discounting them back to today's value. In the case of NEXON, this involves looking at both near-term analyst projections and longer-term estimates based on historic trends and reasonable assumptions.
Currently, NEXON generates Free Cash Flow (FCF) of approximately ¥148 billion, with analysts projecting this figure to be around ¥117 billion by 2027. Beyond those analyst forecasts, Simply Wall St extrapolates future values, resulting in a gradual decline to a projected FCF of roughly ¥104 billion ten years from now. All cash flow figures are quoted in yen and based on the company's official reporting currency.
After discounting these cash flows to reflect their present value, the DCF model arrives at an intrinsic value of ¥1,925 per share. Comparing this to the current share price shows that NEXON stock trades at a 76.5% premium, indicating a significant disconnect between the market price and the company's underlying cash flow potential.
Result: OVERVALUED
Head to the Valuation section of our Company Report for more details on how we arrive at this Fair Value for NEXON.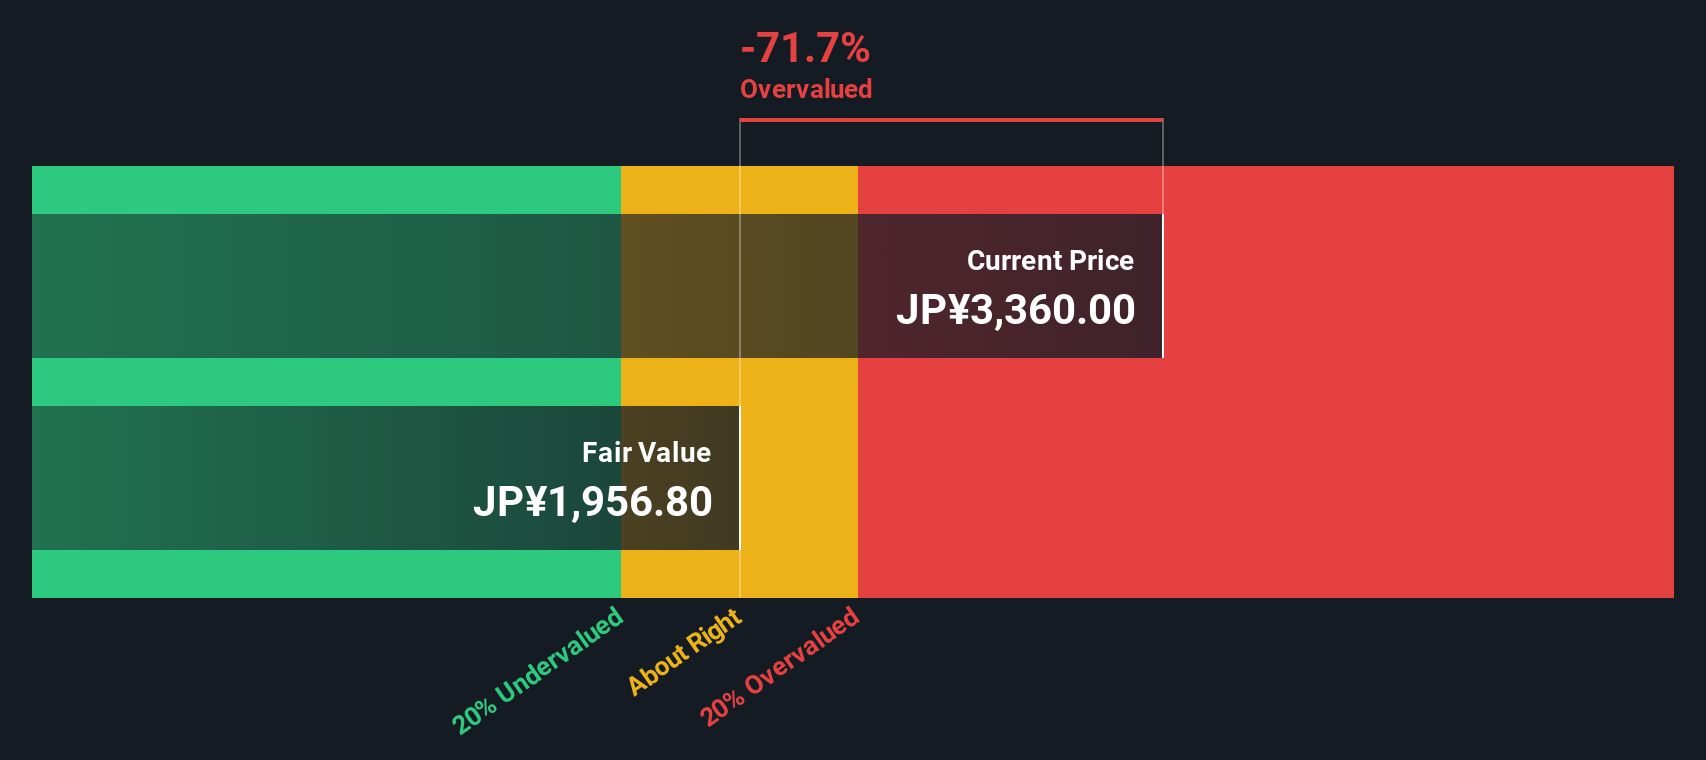
Approach 2: NEXON Price vs Earnings
The Price-to-Earnings (PE) ratio is widely used to value profitable companies because it directly relates a company’s share price to its earnings per share, offering a straightforward sense of what investors are willing to pay for each unit of profit. This makes it a helpful yardstick for businesses like NEXON, which have steady and reliable profits.
However, a "normal" or "fair" PE ratio is not one-size-fits-all. Companies with stronger growth prospects, higher profitability, or lower perceived risks often command higher multiples. Riskier or slower-growing firms may see lower ratios. Comparing those ratios to industry averages or peers can give some context, but it can miss the nuances of each business’s unique situation.
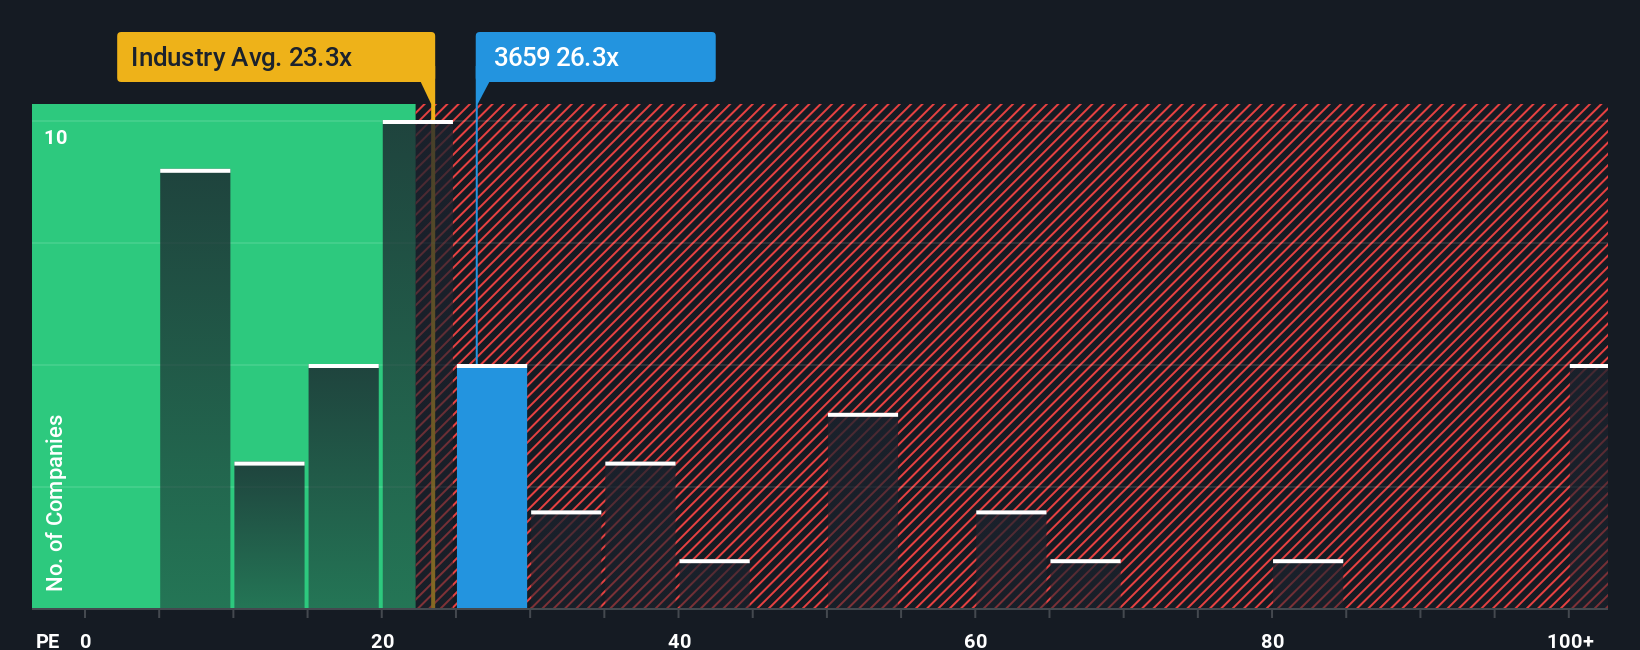
NEXON currently trades on a 26.5x PE ratio. Against the industry average of 23x and a peer average of 38.7x, NEXON’s multiple sits comfortably in the middle of the pack. Simply Wall St’s proprietary “Fair Ratio,” which factors in things like earnings growth, industry dynamics, margins, company size, and risk, stands at 30.5x for NEXON. The Fair Ratio is particularly useful because it looks beyond surface-level comparisons and aims to reflect what the market should pay for a business with NEXON’s specific characteristics.
Since NEXON’s actual PE ratio and its Fair Ratio are within a tight range of one another, this suggests the stock is valued about right by this measure.
Result: ABOUT RIGHT
Upgrade Your Decision Making: Choose your NEXON Narrative
Earlier we mentioned there is an even better way to understand valuation, so let us introduce you to Narratives. A Narrative is a personal investment story that connects your perspective about a company’s future with the key numbers that drive financial forecasts, helping you arrive at your own fair value. Rather than just following analyst targets or waiting for consensus, Narratives let you tie what you believe about NEXON’s business, such as the impact of global expansion or live-service investments, directly to numbers like future revenue, earnings, and margins.
On Simply Wall St’s Community page, creating or exploring Narratives is straightforward, and millions use this dynamic tool to track whether their fair value estimate is above or below today’s share price. This process helps signal if it might be time to buy or sell. Narratives are automatically updated with fresh news, earnings, or key events, so your story always reflects the latest outlook. For NEXON, this means some investors may run optimistic Narratives, believing new titles and successful live-service strategies support a bullish ¥3,700 fair value. Others may adopt a more cautious view, predicting challenges from market saturation and landing closer to a bearish ¥1,900.
Do you think there's more to the story for NEXON? Create your own Narrative to let the Community know!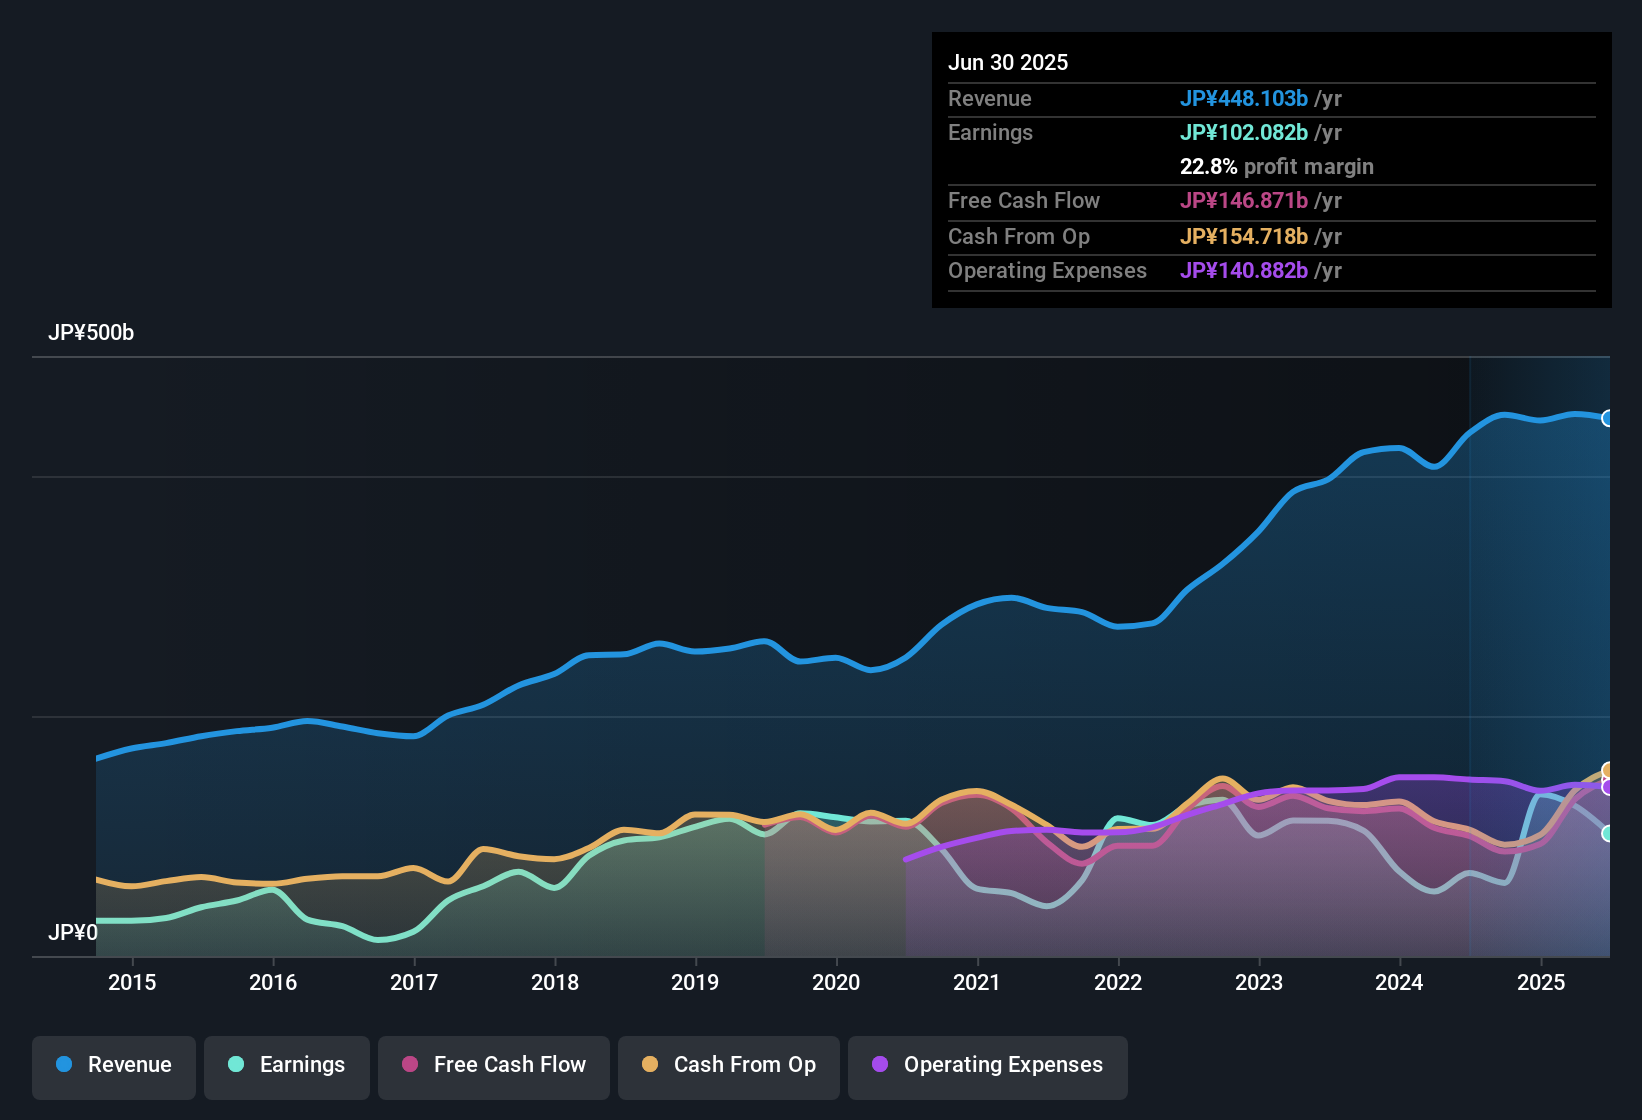
This article by Simply Wall St is general in nature. We provide commentary based on historical data and analyst forecasts only using an unbiased methodology and our articles are not intended to be financial advice. It does not constitute a recommendation to buy or sell any stock, and does not take account of your objectives, or your financial situation. We aim to bring you long-term focused analysis driven by fundamental data. Note that our analysis may not factor in the latest price-sensitive company announcements or qualitative material. Simply Wall St has no position in any stocks mentioned.
Valuation is complex, but we're here to simplify it.
Discover if NEXON might be undervalued or overvalued with our detailed analysis, featuring fair value estimates, potential risks, dividends, insider trades, and its financial condition.
Access Free AnalysisHave feedback on this article? Concerned about the content? Get in touch with us directly. Alternatively, email editorial-team@simplywallst.com
About TSE:3659
NEXON
Produces, develops, distributes, and services PC online and mobile games in Japan and internationally.
Flawless balance sheet with solid track record.
Similar Companies
Market Insights

Advertisement
Community Narratives
Quality at a Premium. A time to watch, not to buy?
Fair Value US$154.56|27.6% undervalued
DA
Community Contributor
GRAB: The Super-App at the Heart of Southeast Asia’s Digital Boom
Fair Value US$8.20|22.1% undervalued
BL
Community Contributor
Verve Group to Surge with 51.61% Revenue Growth
Fair Value €6.00|60.0% undervalued
ME
Community Contributor