Hakuhodo DY Holdings Inc's (TSE:2433) P/S Is Still On The Mark Following 27% Share Price Bounce


The Hakuhodo DY Holdings Inc (TSE:2433) share price has done very well over the last month, posting an excellent gain of 27%. The bad news is that even after the stocks recovery in the last 30 days, shareholders are still underwater by about 4.5% over the last year.
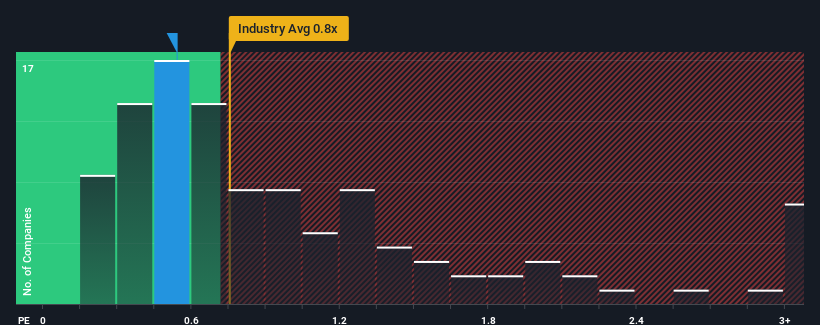
In spite of the firm bounce in price, it's still not a stretch to say that Hakuhodo DY Holdings' price-to-sales (or "P/S") ratio of 0.5x right now seems quite "middle-of-the-road" compared to the Media industry in Japan, where the median P/S ratio is around 0.8x. However, investors might be overlooking a clear opportunity or potential setback if there is no rational basis for the P/S.
View our latest analysis for Hakuhodo DY Holdings
What Does Hakuhodo DY Holdings' Recent Performance Look Like?
Recent times haven't been great for Hakuhodo DY Holdings as its revenue has been rising slower than most other companies. Perhaps the market is expecting future revenue performance to lift, which has kept the P/S from declining. If not, then existing shareholders may be a little nervous about the viability of the share price.
If you'd like to see what analysts are forecasting going forward, you should check out our free report on Hakuhodo DY Holdings.Is There Some Revenue Growth Forecasted For Hakuhodo DY Holdings?
There's an inherent assumption that a company should be matching the industry for P/S ratios like Hakuhodo DY Holdings' to be considered reasonable.
Retrospectively, the last year delivered virtually the same number to the company's top line as the year before. The lack of growth did nothing to help the company's aggregate three-year performance, which is an unsavory 23% drop in revenue. So unfortunately, we have to acknowledge that the company has not done a great job of growing revenue over that time.
Looking ahead now, revenue is anticipated to climb by 4.0% each year during the coming three years according to the six analysts following the company. Meanwhile, the rest of the industry is forecast to expand by 5.0% per annum, which is not materially different.
With this information, we can see why Hakuhodo DY Holdings is trading at a fairly similar P/S to the industry. It seems most investors are expecting to see average future growth and are only willing to pay a moderate amount for the stock.
The Bottom Line On Hakuhodo DY Holdings' P/S
Hakuhodo DY Holdings appears to be back in favour with a solid price jump bringing its P/S back in line with other companies in the industry We'd say the price-to-sales ratio's power isn't primarily as a valuation instrument but rather to gauge current investor sentiment and future expectations.
Our look at Hakuhodo DY Holdings' revenue growth estimates show that its P/S is about what we expect, as both metrics follow closely with the industry averages. At this stage investors feel the potential for an improvement or deterioration in revenue isn't great enough to push P/S in a higher or lower direction. If all things remain constant, the possibility of a drastic share price movement remains fairly remote.
You need to take note of risks, for example - Hakuhodo DY Holdings has 4 warning signs (and 1 which makes us a bit uncomfortable) we think you should know about.
If strong companies turning a profit tickle your fancy, then you'll want to check out this free list of interesting companies that trade on a low P/E (but have proven they can grow earnings).
If you're looking to trade Hakuhodo DY Holdings, open an account with the lowest-cost platform trusted by professionals, Interactive Brokers.
With clients in over 200 countries and territories, and access to 160 markets, IBKR lets you trade stocks, options, futures, forex, bonds and funds from a single integrated account.
Enjoy no hidden fees, no account minimums, and FX conversion rates as low as 0.03%, far better than what most brokers offer.
Sponsored ContentValuation is complex, but we're here to simplify it.
Discover if Hakuhodo DY Holdings might be undervalued or overvalued with our detailed analysis, featuring fair value estimates, potential risks, dividends, insider trades, and its financial condition.
Access Free AnalysisHave feedback on this article? Concerned about the content? Get in touch with us directly. Alternatively, email editorial-team (at) simplywallst.com.
This article by Simply Wall St is general in nature. We provide commentary based on historical data and analyst forecasts only using an unbiased methodology and our articles are not intended to be financial advice. It does not constitute a recommendation to buy or sell any stock, and does not take account of your objectives, or your financial situation. We aim to bring you long-term focused analysis driven by fundamental data. Note that our analysis may not factor in the latest price-sensitive company announcements or qualitative material. Simply Wall St has no position in any stocks mentioned.
About TSE:2433
Hakuhodo DY Holdings
Provides marketing and communications services in Japan and internationally.
Undervalued with excellent balance sheet and pays a dividend.

