
Advertisement
- Japan
- /
- Interactive Media and Services
- /
- TSE:2334
A Piece Of The Puzzle Missing From eole Inc.'s (TSE:2334) 54% Share Price Climb

Despite an already strong run, eole Inc. (TSE:2334) shares have been powering on, with a gain of 54% in the last thirty days. The last 30 days bring the annual gain to a very sharp 79%.
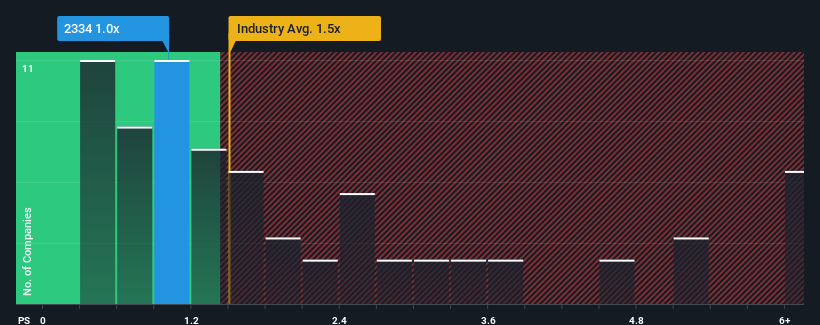
In spite of the firm bounce in price, it's still not a stretch to say that eole's price-to-sales (or "P/S") ratio of 1x right now seems quite "middle-of-the-road" compared to the Interactive Media and Services industry in Japan, where the median P/S ratio is around 1.5x. However, investors might be overlooking a clear opportunity or potential setback if there is no rational basis for the P/S.
Our free stock report includes 3 warning signs investors should be aware of before investing in eole. Read for free now.See our latest analysis for eole
How Has eole Performed Recently?
For example, consider that eole's financial performance has been poor lately as its revenue has been in decline. Perhaps investors believe the recent revenue performance is enough to keep in line with the industry, which is keeping the P/S from dropping off. If you like the company, you'd at least be hoping this is the case so that you could potentially pick up some stock while it's not quite in favour.
Want the full picture on earnings, revenue and cash flow for the company? Then our free report on eole will help you shine a light on its historical performance.Do Revenue Forecasts Match The P/S Ratio?
The only time you'd be comfortable seeing a P/S like eole's is when the company's growth is tracking the industry closely.
Taking a look back first, the company's revenue growth last year wasn't something to get excited about as it posted a disappointing decline of 7.0%. Still, the latest three year period has seen an excellent 70% overall rise in revenue, in spite of its unsatisfying short-term performance. So we can start by confirming that the company has generally done a very good job of growing revenue over that time, even though it had some hiccups along the way.
Comparing that recent medium-term revenue trajectory with the industry's one-year growth forecast of 9.7% shows it's noticeably more attractive.
With this information, we find it interesting that eole is trading at a fairly similar P/S compared to the industry. Apparently some shareholders believe the recent performance is at its limits and have been accepting lower selling prices.
What Does eole's P/S Mean For Investors?
eole's stock has a lot of momentum behind it lately, which has brought its P/S level with the rest of the industry. While the price-to-sales ratio shouldn't be the defining factor in whether you buy a stock or not, it's quite a capable barometer of revenue expectations.
We didn't quite envision eole's P/S sitting in line with the wider industry, considering the revenue growth over the last three-year is higher than the current industry outlook. When we see strong revenue with faster-than-industry growth, we can only assume potential risks are what might be placing pressure on the P/S ratio. At least the risk of a price drop looks to be subdued if recent medium-term revenue trends continue, but investors seem to think future revenue could see some volatility.
You need to take note of risks, for example - eole has 3 warning signs (and 1 which is a bit concerning) we think you should know about.
If companies with solid past earnings growth is up your alley, you may wish to see this free collection of other companies with strong earnings growth and low P/E ratios.
New: Manage All Your Stock Portfolios in One Place
We've created the ultimate portfolio companion for stock investors, and it's free.
• Connect an unlimited number of Portfolios and see your total in one currency
• Be alerted to new Warning Signs or Risks via email or mobile
• Track the Fair Value of your stocks
Have feedback on this article? Concerned about the content? Get in touch with us directly. Alternatively, email editorial-team (at) simplywallst.com.
This article by Simply Wall St is general in nature. We provide commentary based on historical data and analyst forecasts only using an unbiased methodology and our articles are not intended to be financial advice. It does not constitute a recommendation to buy or sell any stock, and does not take account of your objectives, or your financial situation. We aim to bring you long-term focused analysis driven by fundamental data. Note that our analysis may not factor in the latest price-sensitive company announcements or qualitative material. Simply Wall St has no position in any stocks mentioned.
About TSE:2334
eole
Engages in the management of applications for PCs and smartphones in Japan.
Mediocre balance sheet low.
Market Insights

Advertisement
Community Narratives
Scaling up in building materials with smart M&A and growing profitability
Fair Value US$2.77|30.0% undervalued
CM
Community Contributor
Hims: The Platform Powering Personalised Healthcare
Fair Value US$114.01|51.9% undervalued
BL
Community Contributor
Undervalued lottery company with strong fundamentals
Fair Value AU$15.00|34.5% undervalued
RO
Community Contributor
Proximus, transferring money from the impatient to the patient investor
Fair Value €16.62|55.1% undervalued
AX
Community Contributor