- Japan
- /
- Entertainment
- /
- TSE:2121
The five-year decline in earnings for MIXI TSE:2121) isn't encouraging, but shareholders are still up 84% over that period


When you buy and hold a stock for the long term, you definitely want it to provide a positive return. Better yet, you'd like to see the share price move up more than the market average. But MIXI, Inc. (TSE:2121) has fallen short of that second goal, with a share price rise of 47% over five years, which is below the market return. However, if you include the dividends then the return is market beating. Zooming in, the stock is up a respectable 18% in the last year.
While this past week has detracted from the company's five-year return, let's look at the recent trends of the underlying business and see if the gains have been in alignment.
See our latest analysis for MIXI
While markets are a powerful pricing mechanism, share prices reflect investor sentiment, not just underlying business performance. By comparing earnings per share (EPS) and share price changes over time, we can get a feel for how investor attitudes to a company have morphed over time.
During five years of share price growth, MIXI actually saw its EPS drop 16% per year.
Essentially, it doesn't seem likely that investors are focused on EPS. Since the change in EPS doesn't seem to correlate with the change in share price, it's worth taking a look at other metrics.
In contrast revenue growth of 5.3% per year is probably viewed as evidence that MIXI is growing, a real positive. It's quite possible that management are prioritizing revenue growth over EPS growth at the moment.
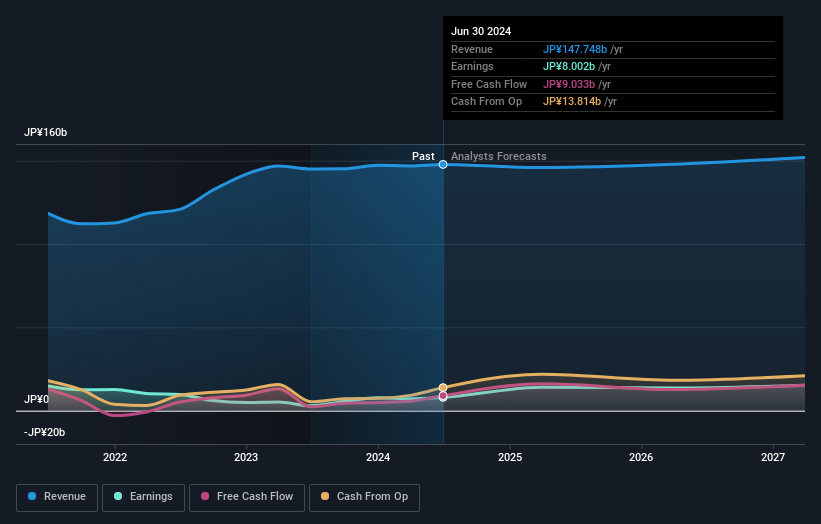
The company's revenue and earnings (over time) are depicted in the image below (click to see the exact numbers).
We know that MIXI has improved its bottom line lately, but what does the future have in store? If you are thinking of buying or selling MIXI stock, you should check out this free report showing analyst profit forecasts.
What About Dividends?
As well as measuring the share price return, investors should also consider the total shareholder return (TSR). The TSR is a return calculation that accounts for the value of cash dividends (assuming that any dividend received was reinvested) and the calculated value of any discounted capital raisings and spin-offs. Arguably, the TSR gives a more comprehensive picture of the return generated by a stock. As it happens, MIXI's TSR for the last 5 years was 84%, which exceeds the share price return mentioned earlier. And there's no prize for guessing that the dividend payments largely explain the divergence!
A Different Perspective
It's good to see that MIXI has rewarded shareholders with a total shareholder return of 23% in the last twelve months. Of course, that includes the dividend. That's better than the annualised return of 13% over half a decade, implying that the company is doing better recently. Someone with an optimistic perspective could view the recent improvement in TSR as indicating that the business itself is getting better with time. It's always interesting to track share price performance over the longer term. But to understand MIXI better, we need to consider many other factors. For example, we've discovered 1 warning sign for MIXI that you should be aware of before investing here.
If you like to buy stocks alongside management, then you might just love this free list of companies. (Hint: many of them are unnoticed AND have attractive valuation).
Please note, the market returns quoted in this article reflect the market weighted average returns of stocks that currently trade on Japanese exchanges.
New: Manage All Your Stock Portfolios in One Place
We've created the ultimate portfolio companion for stock investors, and it's free.
• Connect an unlimited number of Portfolios and see your total in one currency
• Be alerted to new Warning Signs or Risks via email or mobile
• Track the Fair Value of your stocks
Have feedback on this article? Concerned about the content? Get in touch with us directly. Alternatively, email editorial-team (at) simplywallst.com.
This article by Simply Wall St is general in nature. We provide commentary based on historical data and analyst forecasts only using an unbiased methodology and our articles are not intended to be financial advice. It does not constitute a recommendation to buy or sell any stock, and does not take account of your objectives, or your financial situation. We aim to bring you long-term focused analysis driven by fundamental data. Note that our analysis may not factor in the latest price-sensitive company announcements or qualitative material. Simply Wall St has no position in any stocks mentioned.
About TSE:2121
MIXI
Engages in the sports, digital entertainment, lifestyle, and investment businesses in Japan.
Excellent balance sheet with proven track record and pays a dividend.
Similar Companies
Market Insights

Community Narratives
