
Advertisement
Public companies in Shin-Etsu Polymer Co.,Ltd. (TSE:7970) are its biggest bettors, and their bets paid off as stock gained 5.8% last week
Key Insights
- The considerable ownership by public companies in Shin-Etsu PolymerLtd indicates that they collectively have a greater say in management and business strategy
- Shin-Etsu Chemical Co., Ltd. owns 53% of the company
- Institutional ownership in Shin-Etsu PolymerLtd is 15%
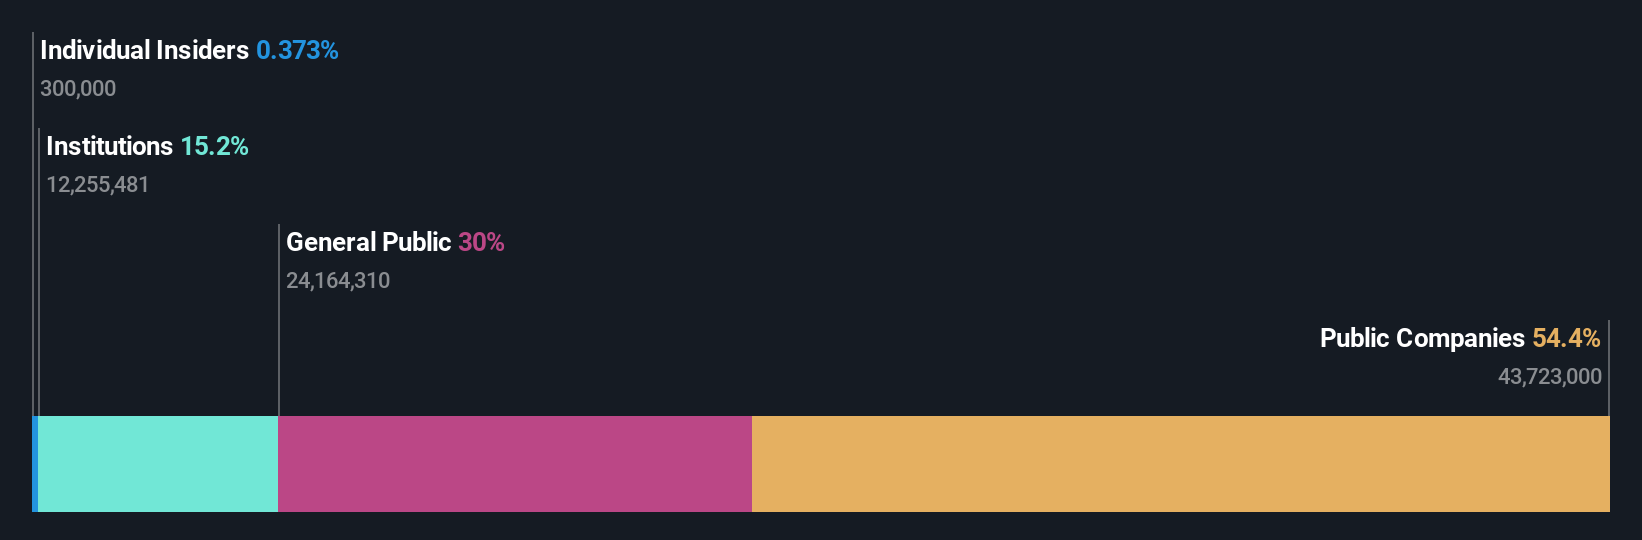
If you want to know who really controls Shin-Etsu Polymer Co.,Ltd. (TSE:7970), then you'll have to look at the makeup of its share registry. We can see that public companies own the lion's share in the company with 54% ownership. That is, the group stands to benefit the most if the stock rises (or lose the most if there is a downturn).
As a result, public companies collectively scored the highest last week as the company hit JP¥135b market cap following a 5.8% gain in the stock.
In the chart below, we zoom in on the different ownership groups of Shin-Etsu PolymerLtd.
Check out our latest analysis for Shin-Etsu PolymerLtd
What Does The Institutional Ownership Tell Us About Shin-Etsu PolymerLtd?
Many institutions measure their performance against an index that approximates the local market. So they usually pay more attention to companies that are included in major indices.
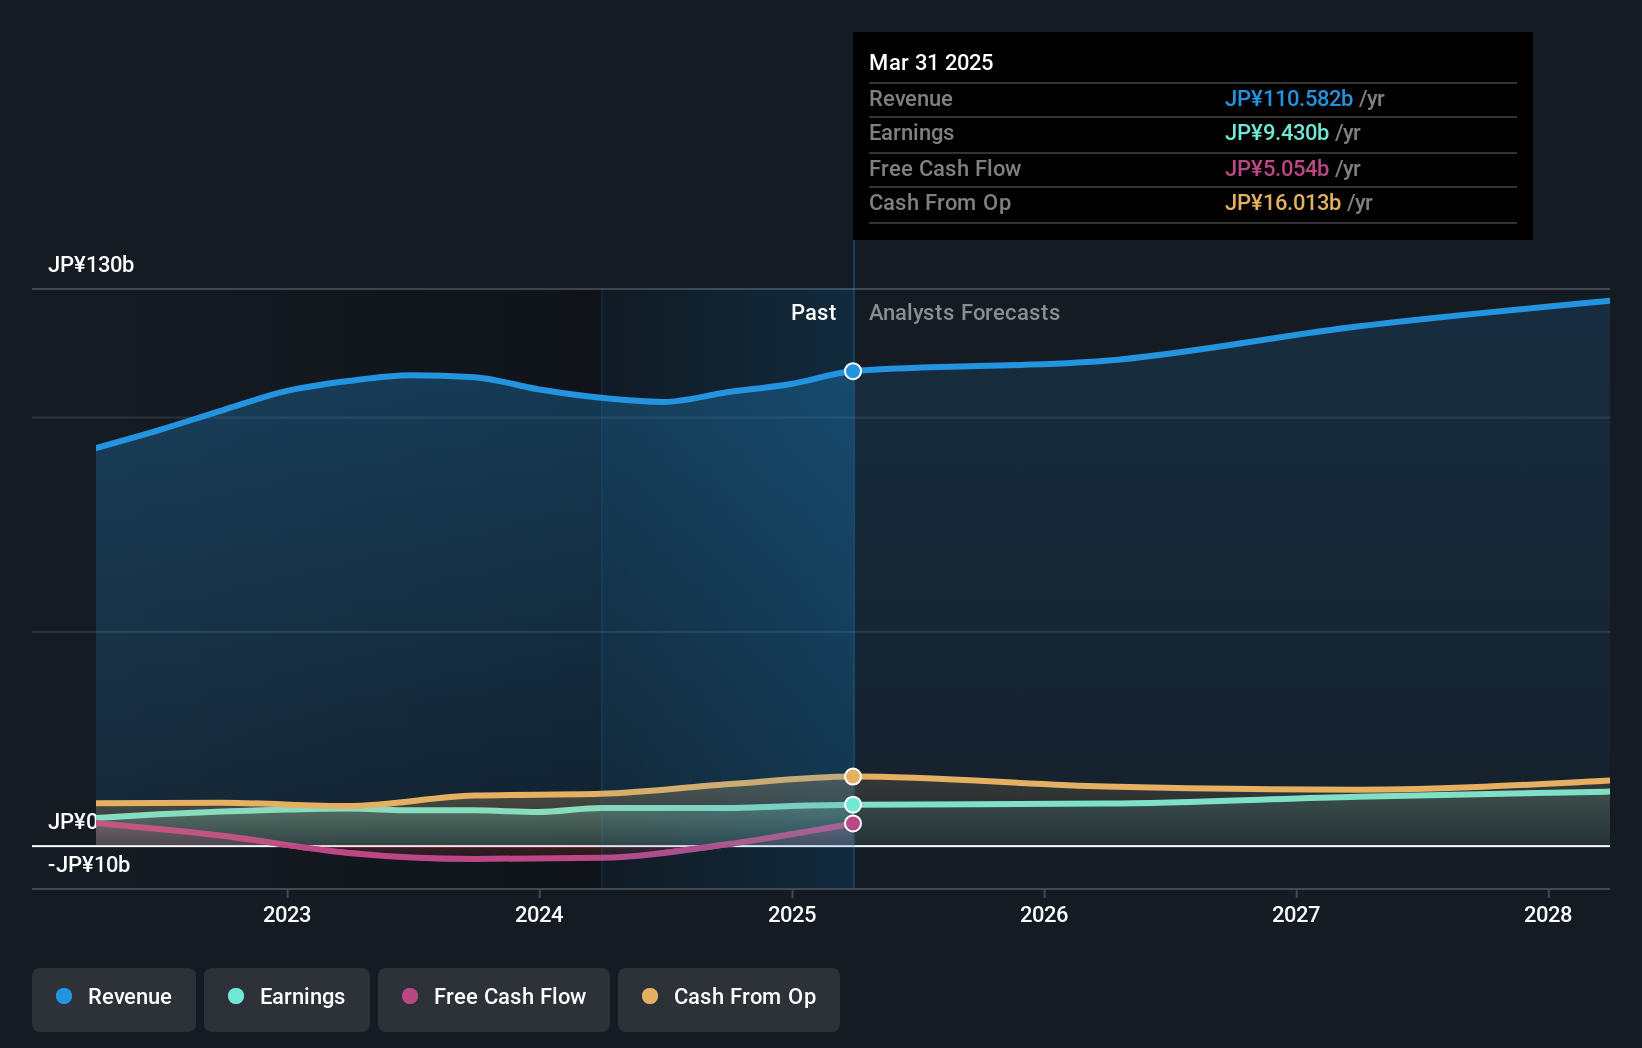
As you can see, institutional investors have a fair amount of stake in Shin-Etsu PolymerLtd. This implies the analysts working for those institutions have looked at the stock and they like it. But just like anyone else, they could be wrong. When multiple institutions own a stock, there's always a risk that they are in a 'crowded trade'. When such a trade goes wrong, multiple parties may compete to sell stock fast. This risk is higher in a company without a history of growth. You can see Shin-Etsu PolymerLtd's historic earnings and revenue below, but keep in mind there's always more to the story.
We note that hedge funds don't have a meaningful investment in Shin-Etsu PolymerLtd. Shin-Etsu Chemical Co., Ltd. is currently the company's largest shareholder with 53% of shares outstanding. This implies that they have majority interest control of the future of the company. For context, the second largest shareholder holds about 1.8% of the shares outstanding, followed by an ownership of 1.6% by the third-largest shareholder.
Researching institutional ownership is a good way to gauge and filter a stock's expected performance. The same can be achieved by studying analyst sentiments. There is a little analyst coverage of the stock, but not much. So there is room for it to gain more coverage.
Insider Ownership Of Shin-Etsu PolymerLtd
While the precise definition of an insider can be subjective, almost everyone considers board members to be insiders. The company management answer to the board and the latter should represent the interests of shareholders. Notably, sometimes top-level managers are on the board themselves.
Insider ownership is positive when it signals leadership are thinking like the true owners of the company. However, high insider ownership can also give immense power to a small group within the company. This can be negative in some circumstances.
Our data suggests that insiders own under 1% of Shin-Etsu Polymer Co.,Ltd. in their own names. It has a market capitalization of just JP¥135b, and the board has only JP¥505m worth of shares in their own names. We generally like to see a board more invested. However it might be worth checking if those insiders have been buying.
General Public Ownership
The general public, who are usually individual investors, hold a 30% stake in Shin-Etsu PolymerLtd. This size of ownership, while considerable, may not be enough to change company policy if the decision is not in sync with other large shareholders.
Public Company Ownership
We can see that public companies hold 54% of the Shin-Etsu PolymerLtd shares on issue. This may be a strategic interest and the two companies may have related business interests. It could be that they have de-merged. This holding is probably worth investigating further.
Next Steps:
I find it very interesting to look at who exactly owns a company. But to truly gain insight, we need to consider other information, too.
Many find it useful to take an in depth look at how a company has performed in the past. You can access this detailed graph of past earnings, revenue and cash flow.
Ultimately the future is most important. You can access this free report on analyst forecasts for the company.
NB: Figures in this article are calculated using data from the last twelve months, which refer to the 12-month period ending on the last date of the month the financial statement is dated. This may not be consistent with full year annual report figures.
New: Manage All Your Stock Portfolios in One Place
We've created the ultimate portfolio companion for stock investors, and it's free.
• Connect an unlimited number of Portfolios and see your total in one currency
• Be alerted to new Warning Signs or Risks via email or mobile
• Track the Fair Value of your stocks
Have feedback on this article? Concerned about the content? Get in touch with us directly. Alternatively, email editorial-team (at) simplywallst.com.
This article by Simply Wall St is general in nature. We provide commentary based on historical data and analyst forecasts only using an unbiased methodology and our articles are not intended to be financial advice. It does not constitute a recommendation to buy or sell any stock, and does not take account of your objectives, or your financial situation. We aim to bring you long-term focused analysis driven by fundamental data. Note that our analysis may not factor in the latest price-sensitive company announcements or qualitative material. Simply Wall St has no position in any stocks mentioned.
About TSE:7970
Shin-Etsu PolymerLtd
Develops and supplies PVC and semiconductor silicone products worldwide.
Flawless balance sheet with solid track record and pays a dividend.
Similar Companies
Market Insights

Advertisement
Community Narratives
A formidable player in AI and enterprise computing.
Fair Value US$210.00|12.2% overvalued
CO
Community Contributor
IREN's Bold Moves in Sustainable Bitcoin Mining & AI Data Centers
Fair Value US$72.52|17.1% undervalued
BL
Community Contributor
Cooling the Champions: The Aussie Tech Behind F1's Victories
Fair Value AU$12.40|38.7% undervalued
TR
Community Contributor