Advertisement
- Japan
- /
- Metals and Mining
- /
- TSE:5706
Assessing Mitsui Kinzoku (TSE:5706) Valuation Following a 196% Year-to-Date Share Price Surge

Simply Wall St
Reviewed by Kshitija Bhandaru
Mitsui Kinzoku Company (TSE:5706) shares have seen significant swings recently, drawing investor attention with a strong run over the past month. The company’s recent stock movement raises questions about what might be driving renewed interest.
See our latest analysis for Mitsui Kinzoku Company.
After surging more than 30% in the past month, Mitsui Kinzoku Company’s share price is now up an impressive 196.6% year-to-date, building on powerful recent momentum. This rise has captured market attention. With a five-year total shareholder return of 560%, investors are clearly starting to re-evaluate the company’s growth prospects and risk profile, especially in light of shifting industry dynamics.
If you’re watching these sharp moves and wondering what other opportunities might be emerging, now is a great moment to broaden your search and discover fast growing stocks with high insider ownership
But with the stock’s near-200% gain so far this year, is Mitsui Kinzoku Company now trading above its intrinsic value? Or does the current price still offer room for further upside?
Price-to-Earnings of 21.3x: Is it justified?
At yesterday’s close of ¥13,660, Mitsui Kinzoku Company trades at 21.3 times earnings. This makes it appear attractively valued relative to peer averages, but expensive compared to the broader industry.
The price-to-earnings (P/E) ratio is a useful yardstick for gauging how much investors are willing to pay for each yen of current earnings. A lower P/E relative to peers can hint at market skepticism or overlooked growth. In contrast, a higher ratio than the industry might raise questions about the sustainability of recent gains.
Mitsui Kinzoku’s P/E stands well below the peer group average of 36.3x, pointing to a company that is cheaper than many direct competitors. However, its multiple is substantially above the Japanese Metals and Mining industry average of 13.5x. Relative to a fair P/E estimate of 20.4x, the stock also appears slightly expensive, suggesting share price momentum has outpaced underlying earnings.
Explore the SWS fair ratio for Mitsui Kinzoku Company
Result: Price-to-Earnings of 21.3x (ABOUT RIGHT)
However, slowing revenue growth and the stock now trading above analyst price targets remain risks that could limit further gains in the near term.
Find out about the key risks to this Mitsui Kinzoku Company narrative.
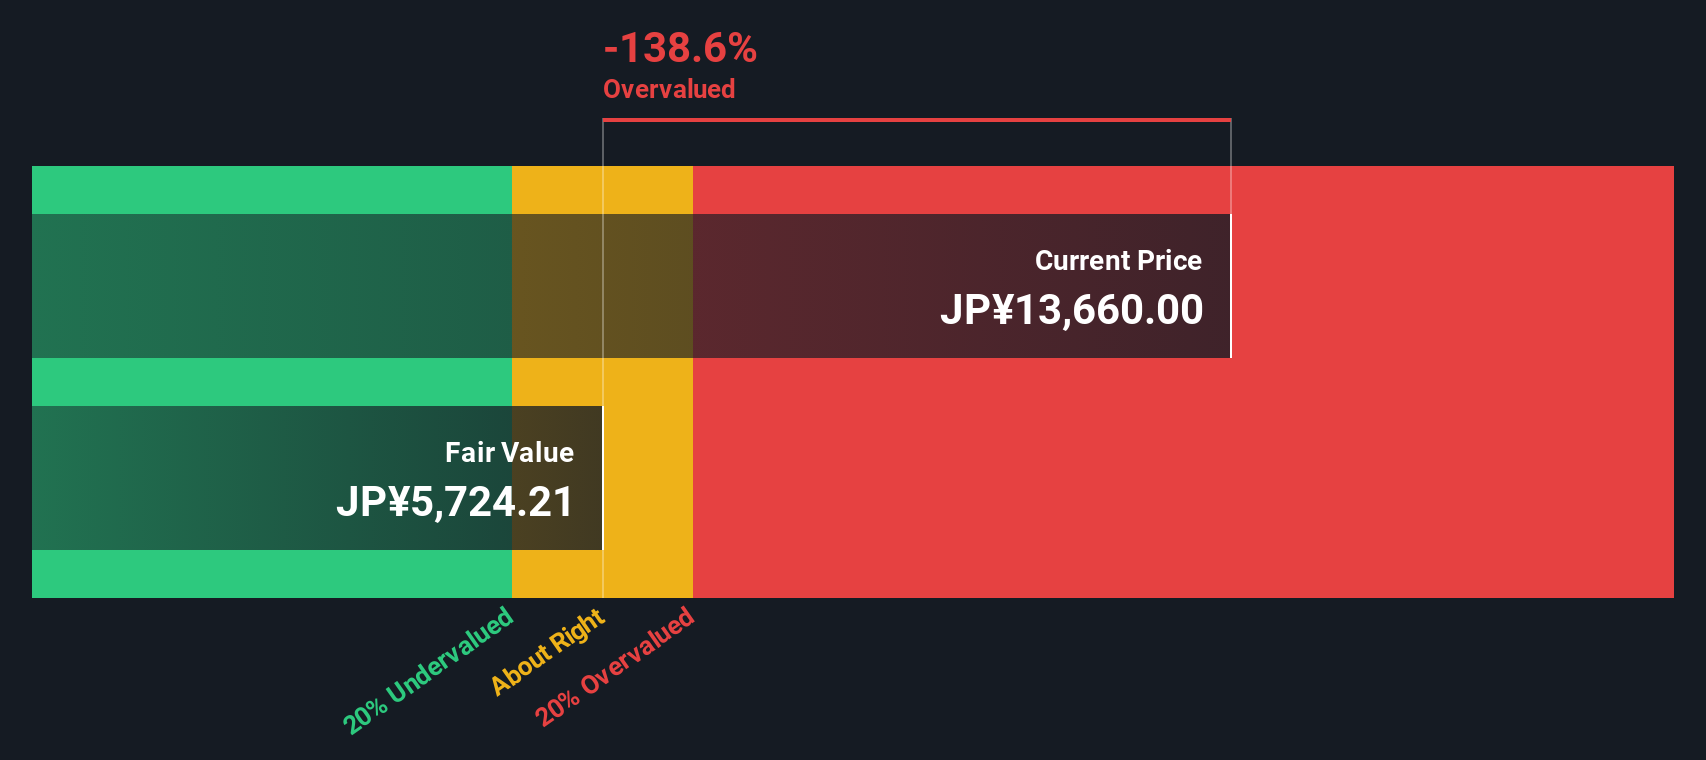
Another View: Discounted Cash Flow Tells a Different Story
Looking beyond earnings multiples, our SWS DCF model suggests Mitsui Kinzoku Company might actually be overvalued, with the current share price well above its intrinsic value estimate. This presents a sharply different perspective. Does this mean recent market optimism is overdone, or are there factors the model might be missing?
Look into how the SWS DCF model arrives at its fair value.
Simply Wall St performs a discounted cash flow (DCF) on every stock in the world every day (check out Mitsui Kinzoku Company for example). We show the entire calculation in full. You can track the result in your watchlist or portfolio and be alerted when this changes, or use our stock screener to discover undervalued stocks based on their cash flows. If you save a screener we even alert you when new companies match - so you never miss a potential opportunity.
Build Your Own Mitsui Kinzoku Company Narrative
If you’re not convinced by these conclusions or would rather rely on your own analysis, you can craft a personal assessment in under three minutes. Do it your way
A great starting point for your Mitsui Kinzoku Company research is our analysis highlighting 1 key reward and 2 important warning signs that could impact your investment decision.
Looking for more investment ideas?
Smart investors never settle for one opportunity. Let Simply Wall Street Screener highlight standout stocks you might overlook and help you spot your next winning investment.
- Uncover fresh potential by checking out these 893 undervalued stocks based on cash flows, where established companies may be trading for less than their true worth.
- Tap into tomorrow’s growth by browsing these 25 AI penny stocks and find firms at the forefront of artificial intelligence innovation right now.
- Boost your portfolio’s income with these 18 dividend stocks with yields > 3%, featuring stocks that offer reliable yields surpassing 3% and help grow your returns.
This article by Simply Wall St is general in nature. We provide commentary based on historical data and analyst forecasts only using an unbiased methodology and our articles are not intended to be financial advice. It does not constitute a recommendation to buy or sell any stock, and does not take account of your objectives, or your financial situation. We aim to bring you long-term focused analysis driven by fundamental data. Note that our analysis may not factor in the latest price-sensitive company announcements or qualitative material. Simply Wall St has no position in any stocks mentioned.
New: Manage All Your Stock Portfolios in One Place
We've created the ultimate portfolio companion for stock investors, and it's free.
• Connect an unlimited number of Portfolios and see your total in one currency
• Be alerted to new Warning Signs or Risks via email or mobile
• Track the Fair Value of your stocks
Have feedback on this article? Concerned about the content? Get in touch with us directly. Alternatively, email editorial-team@simplywallst.com
About TSE:5706
Mitsui Kinzoku Company
Engages in the manufacture and sale of metal products in Japan and internationally.
Flawless balance sheet second-rate dividend payer.
Market Insights

Advertisement
Community Narratives
A formidable player in AI and enterprise computing.
Fair Value US$210.00|12.2% overvalued
CO
Community Contributor
IREN's Bold Moves in Sustainable Bitcoin Mining & AI Data Centers
Fair Value US$72.52|17.1% undervalued
BL
Community Contributor
Cooling the Champions: The Aussie Tech Behind F1's Victories
Fair Value AU$12.40|38.7% undervalued
TR
Community Contributor