Advertisement
DIC (TSE:4631): Evaluating Valuation as Investor Interest Grows After Recent Share Price Movement

Simply Wall St
Reviewed by Kshitija Bhandaru
DIC (TSE:4631) has caught the attention of investors after a recent shift in its stock performance. With shares showing some movement over the past month, many are weighing what this could mean for the company’s outlook.
See our latest analysis for DIC.
After some recent volatility, DIC’s share price has cooled slightly in the past month. However, its impressive 23.05% share price return over the last quarter and 9.17% total shareholder return for the past year indicate that momentum may still be in play for longer-term investors, especially following its strong multi-year gains.
If you’re curious about what else might be gathering steam right now, consider broadening your search to discover fast growing stocks with high insider ownership
With shares trading below analyst targets but up significantly over the past several years, the critical question now is whether DIC remains undervalued or if the market has already factored in its future growth potential.
Price-to-Earnings of 12.1x: Is it justified?
DIC shares are currently trading at a price-to-earnings (P/E) ratio of 12.1x, which stands out when compared to its sector and peers. With the last close at ¥3,585, this level suggests the market may be overlooking the company’s recent return to profitability and ongoing growth prospects.
The price-to-earnings ratio indicates how much investors are willing to pay per yen of earnings. For a business like DIC, which just became profitable this year, a lower P/E could mean that the market is not yet pricing in its earnings recovery or expecting slower growth ahead.
Compared to both the peer average of 22.3x and the Japanese Chemicals industry average of 13x, DIC’s multiple looks attractive. Furthermore, the company's P/E is even below the estimated fair P/E ratio of 14.8x, which may signal the potential for the market to re-rate if earnings momentum sustains.
Explore the SWS fair ratio for DIC
Result: Price-to-Earnings of 12.1x (UNDERVALUED)
However, slower revenue growth and potential market fluctuations could quickly reverse sentiment, reminding investors that DIC's outlook is not without its uncertainties.
Find out about the key risks to this DIC narrative.
Another View: SWS DCF Model Suggests Even More Value
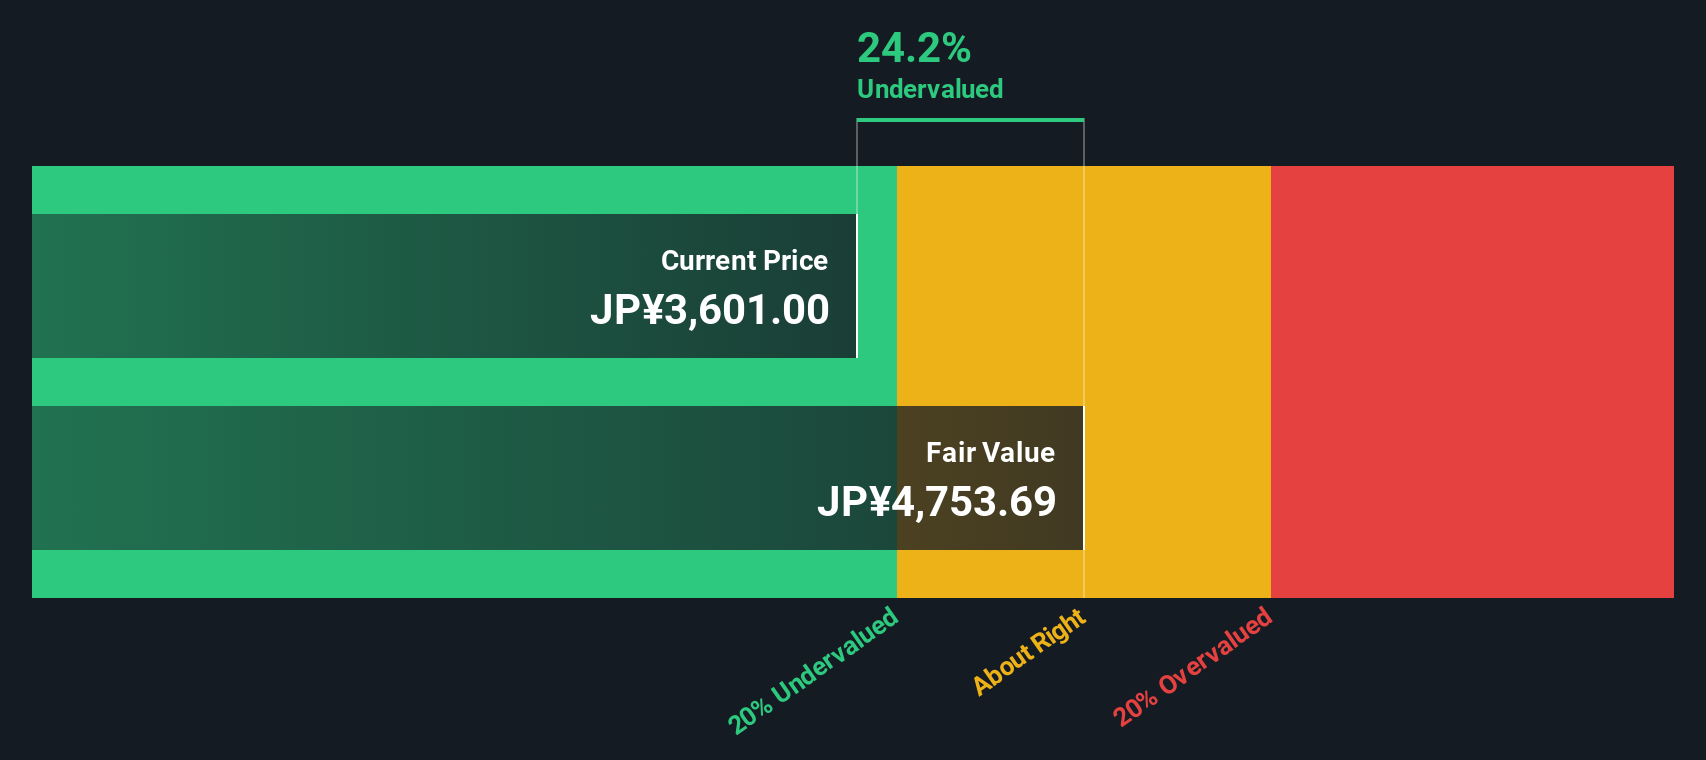
While the price-to-earnings ratio signals DIC may be undervalued compared to its peers, our SWS DCF model estimates the company's fair value at ¥4,753.63. This is significantly above the current trading price of ¥3,585, indicating DIC could be even more undervalued than it first appears. Could the market be missing something bigger about DIC's future cash flows?
Look into how the SWS DCF model arrives at its fair value.
Simply Wall St performs a discounted cash flow (DCF) on every stock in the world every day (check out DIC for example). We show the entire calculation in full. You can track the result in your watchlist or portfolio and be alerted when this changes, or use our stock screener to discover undervalued stocks based on their cash flows. If you save a screener we even alert you when new companies match - so you never miss a potential opportunity.
Build Your Own DIC Narrative
If you prefer to investigate the numbers on your own or have a different perspective, you can craft your own narrative in just a few minutes. Do it your way
A great starting point for your DIC research is our analysis highlighting 4 key rewards and 2 important warning signs that could impact your investment decision.
Looking for more investment ideas?
Don’t let opportunity pass you by when other potential winners could be within reach. Check out these high-potential areas where smart capital is already moving:
- Start building wealth from the ground up as you scan for hidden value plays among these 3576 penny stocks with strong financials with robust financial foundations.
- Unlock passive income by targeting stable payouts via these 18 dividend stocks with yields > 3% offering generous yields and consistent performance.
- Ride the rapid pace of artificial intelligence innovation by finding front-runners through these 25 AI penny stocks that are shaking up entire industries.
This article by Simply Wall St is general in nature. We provide commentary based on historical data and analyst forecasts only using an unbiased methodology and our articles are not intended to be financial advice. It does not constitute a recommendation to buy or sell any stock, and does not take account of your objectives, or your financial situation. We aim to bring you long-term focused analysis driven by fundamental data. Note that our analysis may not factor in the latest price-sensitive company announcements or qualitative material. Simply Wall St has no position in any stocks mentioned.
New: Manage All Your Stock Portfolios in One Place
We've created the ultimate portfolio companion for stock investors, and it's free.
• Connect an unlimited number of Portfolios and see your total in one currency
• Be alerted to new Warning Signs or Risks via email or mobile
• Track the Fair Value of your stocks
Have feedback on this article? Concerned about the content? Get in touch with us directly. Alternatively, email editorial-team@simplywallst.com
About TSE:4631
DIC
Manufactures and sells printing inks, organic pigments, and synthetic resins worldwide.
Undervalued average dividend payer.
Similar Companies
Market Insights

Advertisement
Community Narratives
A formidable player in AI and enterprise computing.
Fair Value US$210.00|12.2% overvalued
CO
Community Contributor
IREN's Bold Moves in Sustainable Bitcoin Mining & AI Data Centers
Fair Value US$72.52|17.1% undervalued
BL
Community Contributor
Cooling the Champions: The Aussie Tech Behind F1's Victories
Fair Value AU$12.40|38.7% undervalued
TR
Community Contributor