
Advertisement

Legendary fund manager Li Lu (who Charlie Munger backed) once said, 'The biggest investment risk is not the volatility of prices, but whether you will suffer a permanent loss of capital.' It's only natural to consider a company's balance sheet when you examine how risky it is, since debt is often involved when a business collapses. As with many other companies Sk Kaken Co.,Ltd. (TSE:4628) makes use of debt. But the real question is whether this debt is making the company risky.
When Is Debt Dangerous?
Generally speaking, debt only becomes a real problem when a company can't easily pay it off, either by raising capital or with its own cash flow. In the worst case scenario, a company can go bankrupt if it cannot pay its creditors. However, a more common (but still painful) scenario is that it has to raise new equity capital at a low price, thus permanently diluting shareholders. Of course, the upside of debt is that it often represents cheap capital, especially when it replaces dilution in a company with the ability to reinvest at high rates of return. When we examine debt levels, we first consider both cash and debt levels, together.
View our latest analysis for Sk KakenLtd
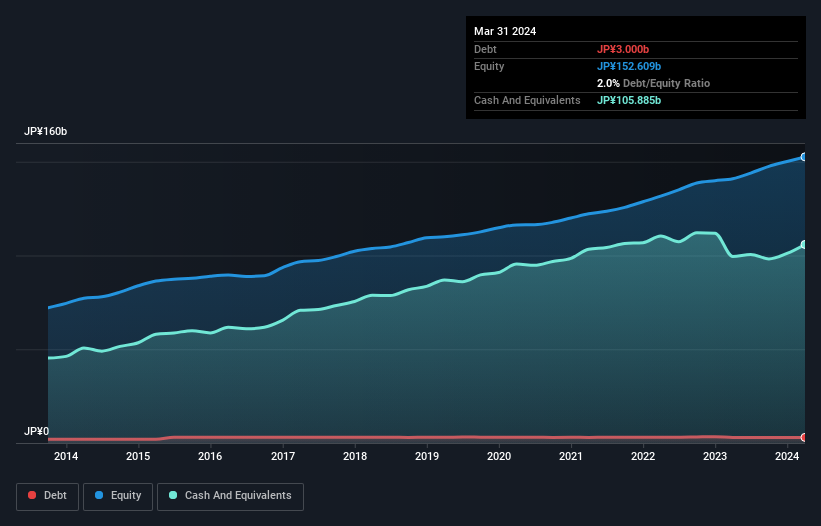
What Is Sk KakenLtd's Debt?
The chart below, which you can click on for greater detail, shows that Sk KakenLtd had JP¥3.00b in debt in March 2024; about the same as the year before. However, it does have JP¥105.9b in cash offsetting this, leading to net cash of JP¥102.9b.
A Look At Sk KakenLtd's Liabilities
Zooming in on the latest balance sheet data, we can see that Sk KakenLtd had liabilities of JP¥26.4b due within 12 months and liabilities of JP¥4.11b due beyond that. On the other hand, it had cash of JP¥105.9b and JP¥22.1b worth of receivables due within a year. So it can boast JP¥97.5b more liquid assets than total liabilities.
This excess liquidity is a great indication that Sk KakenLtd's balance sheet is almost as strong as Fort Knox. Having regard to this fact, we think its balance sheet is as strong as an ox. Simply put, the fact that Sk KakenLtd has more cash than debt is arguably a good indication that it can manage its debt safely.
Another good sign is that Sk KakenLtd has been able to increase its EBIT by 22% in twelve months, making it easier to pay down debt. The balance sheet is clearly the area to focus on when you are analysing debt. But it is Sk KakenLtd's earnings that will influence how the balance sheet holds up in the future. So if you're keen to discover more about its earnings, it might be worth checking out this graph of its long term earnings trend.
Finally, a business needs free cash flow to pay off debt; accounting profits just don't cut it. Sk KakenLtd may have net cash on the balance sheet, but it is still interesting to look at how well the business converts its earnings before interest and tax (EBIT) to free cash flow, because that will influence both its need for, and its capacity to manage debt. Over the most recent three years, Sk KakenLtd recorded free cash flow worth 71% of its EBIT, which is around normal, given free cash flow excludes interest and tax. This free cash flow puts the company in a good position to pay down debt, when appropriate.
Summing Up
While we empathize with investors who find debt concerning, you should keep in mind that Sk KakenLtd has net cash of JP¥102.9b, as well as more liquid assets than liabilities. And it impressed us with free cash flow of JP¥8.5b, being 71% of its EBIT. The bottom line is that we do not find Sk KakenLtd's debt levels at all concerning. Above most other metrics, we think its important to track how fast earnings per share is growing, if at all. If you've also come to that realization, you're in luck, because today you can view this interactive graph of Sk KakenLtd's earnings per share history for free.
If you're interested in investing in businesses that can grow profits without the burden of debt, then check out this free list of growing businesses that have net cash on the balance sheet.
New: Manage All Your Stock Portfolios in One Place
We've created the ultimate portfolio companion for stock investors, and it's free.
• Connect an unlimited number of Portfolios and see your total in one currency
• Be alerted to new Warning Signs or Risks via email or mobile
• Track the Fair Value of your stocks
Have feedback on this article? Concerned about the content? Get in touch with us directly. Alternatively, email editorial-team (at) simplywallst.com.
This article by Simply Wall St is general in nature. We provide commentary based on historical data and analyst forecasts only using an unbiased methodology and our articles are not intended to be financial advice. It does not constitute a recommendation to buy or sell any stock, and does not take account of your objectives, or your financial situation. We aim to bring you long-term focused analysis driven by fundamental data. Note that our analysis may not factor in the latest price-sensitive company announcements or qualitative material. Simply Wall St has no position in any stocks mentioned.
Have feedback on this article? Concerned about the content? Get in touch with us directly. Alternatively, email editorial-team@simplywallst.com
About TSE:4628
Sk KakenLtd
Engages in the manufacture and sale of organic and inorganic water-based coating materials, synthetic resin paints, inorganic coating materials, and inorganic building materials in Japan and internationally.
Flawless balance sheet average dividend payer.
Similar Companies
Market Insights

Advertisement
Community Narratives
Pinterest will surge as advertising innovations ignite revenue growth
Fair Value US$42.63|26.3% undervalued
BR
Community Contributor
Brambles' Revenue Set to Climb 14% with Profit Margins Following
Fair Value AU$21.90|4.9% overvalued
RO
Community Contributor
Challenging Future for STG as Organic Sales Decline by 8.8%
Fair Value DKK 116.13|26.8% undervalued
KA
Community Contributor