- Japan
- /
- Personal Products
- /
- TSE:4917
September 2024's Japanese Stocks Possibly Trading Below Fair Value Estimates

Reviewed by Simply Wall St

In recent weeks, Japan's stock markets have experienced notable declines, with the Nikkei 225 Index falling by 5.8% and the broader TOPIX Index losing 4.2%. This downturn is partly attributed to a U.S.-led sell-off in semiconductor stocks and yen strength impacting export-oriented companies. In such a volatile environment, identifying stocks that may be trading below their fair value can offer potential opportunities for investors looking to capitalize on market inefficiencies.
Top 10 Undervalued Stocks Based On Cash Flows In Japan
| Name | Current Price | Fair Value (Est) | Discount (Est) |
| Densan System Holdings (TSE:4072) | ¥2692.00 | ¥5375.70 | 49.9% |
| Hagiwara Electric Holdings (TSE:7467) | ¥3495.00 | ¥6818.22 | 48.7% |
| Kotobuki Spirits (TSE:2222) | ¥1794.50 | ¥3434.73 | 47.8% |
| Taiyo Yuden (TSE:6976) | ¥3200.00 | ¥6172.29 | 48.2% |
| Hottolink (TSE:3680) | ¥335.00 | ¥639.65 | 47.6% |
| West Holdings (TSE:1407) | ¥2588.00 | ¥5127.01 | 49.5% |
| KeePer Technical Laboratory (TSE:6036) | ¥3990.00 | ¥7903.28 | 49.5% |
| Infomart (TSE:2492) | ¥319.00 | ¥619.62 | 48.5% |
| Ohara (TSE:5218) | ¥1365.00 | ¥2618.27 | 47.9% |
| SHIFT (TSE:3697) | ¥12200.00 | ¥23431.38 | 47.9% |
Let's take a closer look at a couple of our picks from the screened companies.
Nippon Kayaku (TSE:4272)
Overview: Nippon Kayaku Co., Ltd. and its subsidiaries develop, manufacture, and sell functional chemicals, pharmaceuticals, safety systems, agrochemicals, and other products both in Japan and internationally with a market cap of ¥212.57 billion.
Operations: The company's revenue segments include Fine Chemicals (¥59.50 billion), Life Science Business Unit (¥62.72 billion), and Mobility & Imaging Business Unit (¥84.83 billion).
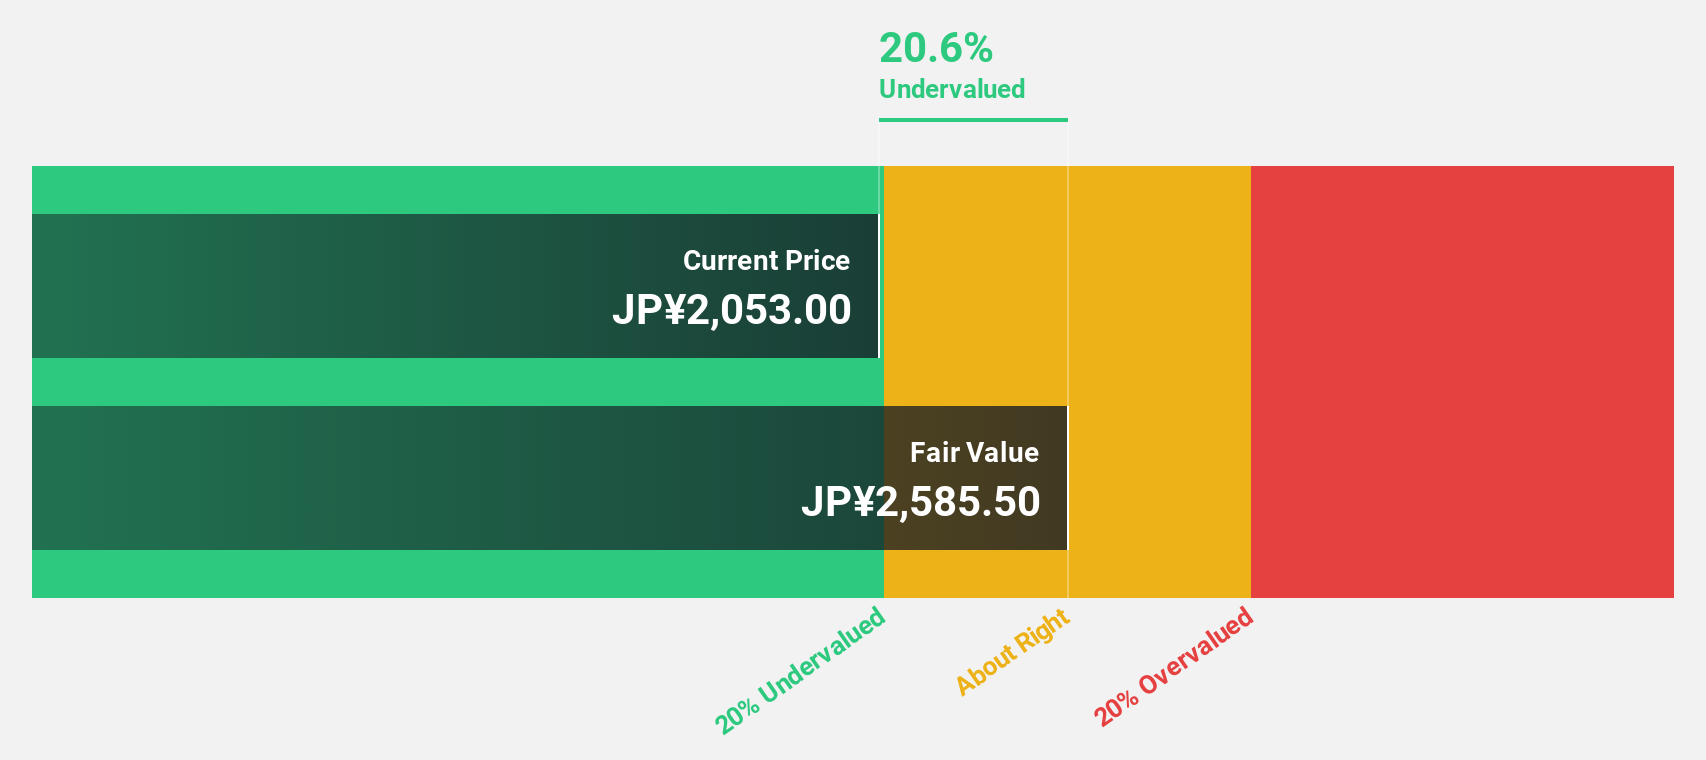
Estimated Discount To Fair Value: 10.9%
Nippon Kayaku is trading at ¥1290.5, approximately 10.9% below its fair value estimate of ¥1447.6 based on discounted cash flows. Despite lower profit margins this year (2.4% vs 5.9%), earnings are projected to grow significantly at 34.35% annually, outpacing the Japanese market's 8.6%. Recent corporate guidance revisions show improved expectations for net sales and operating income, indicating stronger future cash flows and potential undervaluation opportunities for investors focused on cash flow metrics.
- Insights from our recent growth report point to a promising forecast for Nippon Kayaku's business outlook.
- Unlock comprehensive insights into our analysis of Nippon Kayaku stock in this financial health report.
Mandom (TSE:4917)
Overview: Mandom Corporation manufactures and sells cosmetics, perfumes, and quasi-drugs in Japan, Indonesia, and internationally with a market cap of ¥55.66 billion.
Operations: The company's revenue segments are ¥44.54 billion from Japan, ¥18.24 billion from Indonesia, and ¥21.10 billion from other overseas markets.
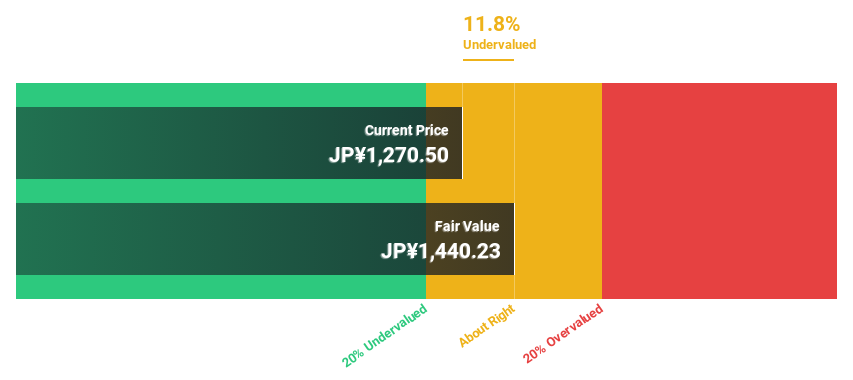
Estimated Discount To Fair Value: 12.7%
Mandom, currently trading at ¥1239, is valued 12.7% below its estimated fair value of ¥1419.81 based on discounted cash flows. Despite a low forecasted return on equity (5.6%) in three years and recent large one-off items affecting earnings quality, the company's earnings are projected to grow significantly at 27.57% annually over the next three years, surpassing the Japanese market's growth rate of 8.6%, highlighting its potential undervaluation for cash flow-focused investors.
- According our earnings growth report, there's an indication that Mandom might be ready to expand.
- Click here and access our complete balance sheet health report to understand the dynamics of Mandom.
Insource (TSE:6200)
Overview: Insource Co., Ltd. offers a range of training services, including lecturer dispatch and open lectures, in Japan and has a market cap of ¥88.43 billion.
Operations: The company generates ¥12.06 billion in revenue from its Education Service Business segment.
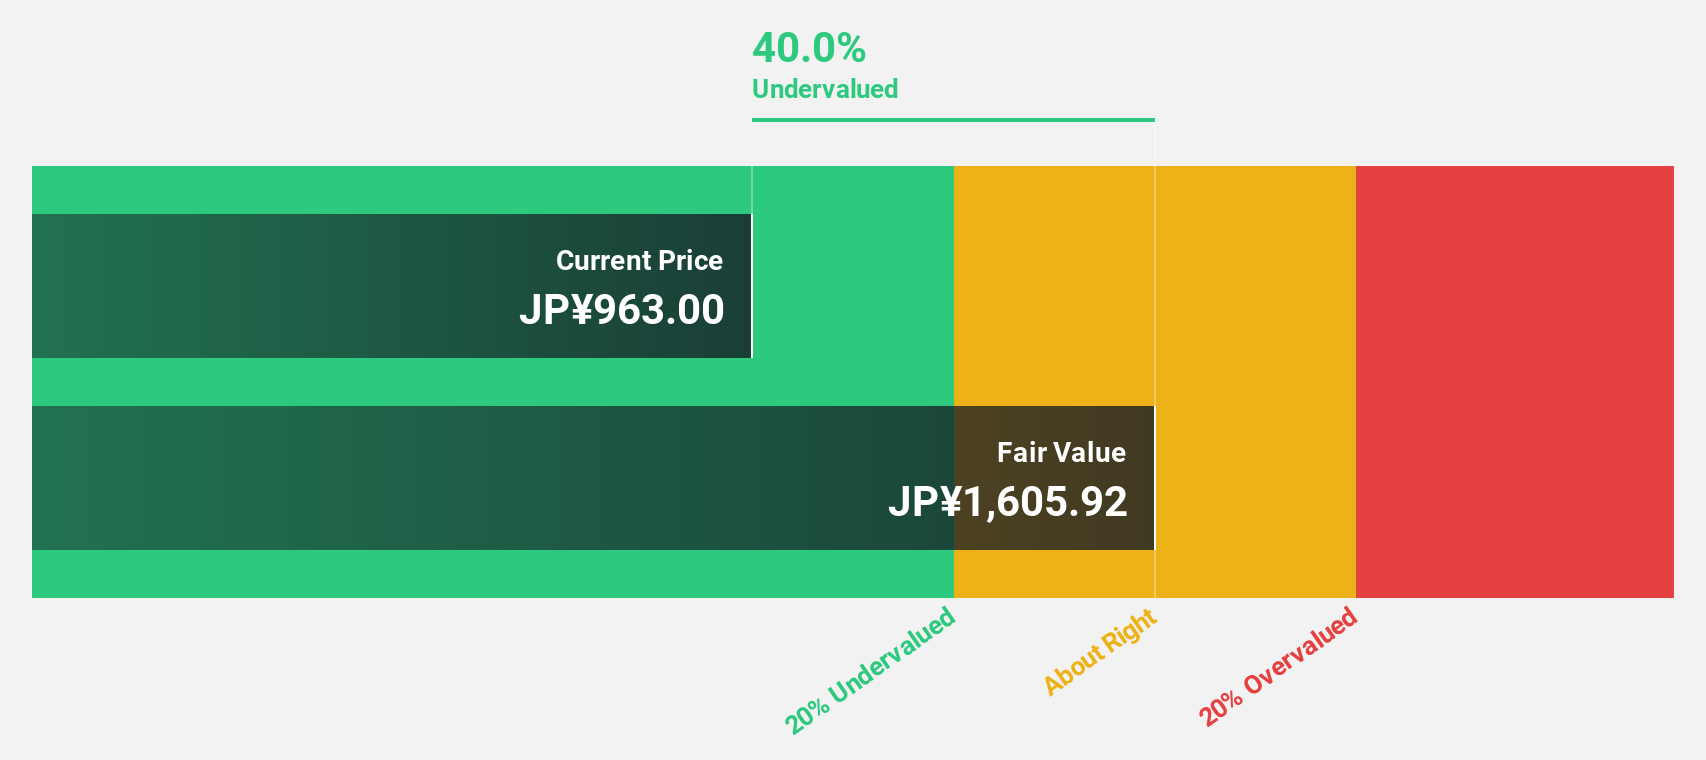
Estimated Discount To Fair Value: 34.3%
Insource, trading at ¥1054, is 34.3% below its fair value estimate of ¥1605.24 based on discounted cash flows. The company's earnings grew by 29% last year and are expected to grow at 18.65% per year over the next three years, outpacing the JP market's growth rate of 8.6%. Despite an unstable dividend track record, recent guidance revisions indicate stronger financial performance with higher net sales and profits than previously forecasted for FY2024.
- In light of our recent growth report, it seems possible that Insource's financial performance will exceed current levels.
- Take a closer look at Insource's balance sheet health here in our report.
Summing It All Up
- Click this link to deep-dive into the 85 companies within our Undervalued Japanese Stocks Based On Cash Flows screener.
- Hold shares in these firms? Setup your portfolio in Simply Wall St to seamlessly track your investments and receive personalized updates on your portfolio's performance.
- Simply Wall St is a revolutionary app designed for long-term stock investors, it's free and covers every market in the world.
Ready For A Different Approach?
- Explore high-performing small cap companies that haven't yet garnered significant analyst attention.
- Diversify your portfolio with solid dividend payers offering reliable income streams to weather potential market turbulence.
- Fuel your portfolio with companies showing strong growth potential, backed by optimistic outlooks both from analysts and management.
This article by Simply Wall St is general in nature. We provide commentary based on historical data and analyst forecasts only using an unbiased methodology and our articles are not intended to be financial advice. It does not constitute a recommendation to buy or sell any stock, and does not take account of your objectives, or your financial situation. We aim to bring you long-term focused analysis driven by fundamental data. Note that our analysis may not factor in the latest price-sensitive company announcements or qualitative material. Simply Wall St has no position in any stocks mentioned.
New: Manage All Your Stock Portfolios in One Place
We've created the ultimate portfolio companion for stock investors, and it's free.
• Connect an unlimited number of Portfolios and see your total in one currency
• Be alerted to new Warning Signs or Risks via email or mobile
• Track the Fair Value of your stocks
Have feedback on this article? Concerned about the content? Get in touch with us directly. Alternatively, email editorial-team@simplywallst.com
About TSE:4917
Mandom
Engages in the manufacture and sale of cosmetics, perfumes, and quasi-drugs in Japan, Indonesia, and internationally.
Excellent balance sheet established dividend payer.
