
Advertisement
Kodama Chemical Industry Co.,Ltd.'s (TSE:4222) P/S Is Still On The Mark Following 110% Share Price Bounce
Kodama Chemical Industry Co.,Ltd. (TSE:4222) shareholders would be excited to see that the share price has had a great month, posting a 110% gain and recovering from prior weakness. The annual gain comes to 162% following the latest surge, making investors sit up and take notice.
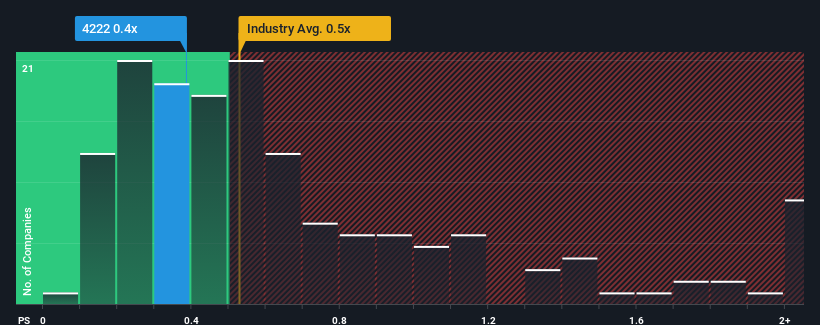
In spite of the firm bounce in price, you could still be forgiven for feeling indifferent about Kodama Chemical IndustryLtd's P/S ratio of 0.4x, since the median price-to-sales (or "P/S") ratio for the Chemicals industry in Japan is also close to 0.5x. However, investors might be overlooking a clear opportunity or potential setback if there is no rational basis for the P/S.
See our latest analysis for Kodama Chemical IndustryLtd
What Does Kodama Chemical IndustryLtd's P/S Mean For Shareholders?
Revenue has risen firmly for Kodama Chemical IndustryLtd recently, which is pleasing to see. One possibility is that the P/S is moderate because investors think this respectable revenue growth might not be enough to outperform the broader industry in the near future. If you like the company, you'd be hoping this isn't the case so that you could potentially pick up some stock while it's not quite in favour.
Although there are no analyst estimates available for Kodama Chemical IndustryLtd, take a look at this free data-rich visualisation to see how the company stacks up on earnings, revenue and cash flow.Is There Some Revenue Growth Forecasted For Kodama Chemical IndustryLtd?
There's an inherent assumption that a company should be matching the industry for P/S ratios like Kodama Chemical IndustryLtd's to be considered reasonable.
Taking a look back first, we see that the company managed to grow revenues by a handy 7.8% last year. The solid recent performance means it was also able to grow revenue by 6.4% in total over the last three years. Accordingly, shareholders would have probably been satisfied with the medium-term rates of revenue growth.
Comparing that to the industry, which is predicted to deliver 4.0% growth in the next 12 months, the company's momentum is pretty similar based on recent medium-term annualised revenue results.
With this in consideration, it's clear to see why Kodama Chemical IndustryLtd's P/S matches up closely to its industry peers. It seems most investors are expecting to see average growth rates continue into the future and are only willing to pay a moderate amount for the stock.
What We Can Learn From Kodama Chemical IndustryLtd's P/S?
Its shares have lifted substantially and now Kodama Chemical IndustryLtd's P/S is back within range of the industry median. We'd say the price-to-sales ratio's power isn't primarily as a valuation instrument but rather to gauge current investor sentiment and future expectations.
It appears to us that Kodama Chemical IndustryLtd maintains its moderate P/S off the back of its recent three-year growth being in line with the wider industry forecast. Currently, with a past revenue trend that aligns closely wit the industry outlook, shareholders are confident the company's future revenue outlook won't contain any major surprises. If recent medium-term revenue trends continue, it's hard to see the share price moving strongly in either direction in the near future under these circumstances.
Having said that, be aware Kodama Chemical IndustryLtd is showing 3 warning signs in our investment analysis, and 2 of those are a bit unpleasant.
If companies with solid past earnings growth is up your alley, you may wish to see this free collection of other companies with strong earnings growth and low P/E ratios.
Valuation is complex, but we're here to simplify it.
Discover if Kodama Chemical IndustryLtd might be undervalued or overvalued with our detailed analysis, featuring fair value estimates, potential risks, dividends, insider trades, and its financial condition.
Access Free AnalysisHave feedback on this article? Concerned about the content? Get in touch with us directly. Alternatively, email editorial-team (at) simplywallst.com.
This article by Simply Wall St is general in nature. We provide commentary based on historical data and analyst forecasts only using an unbiased methodology and our articles are not intended to be financial advice. It does not constitute a recommendation to buy or sell any stock, and does not take account of your objectives, or your financial situation. We aim to bring you long-term focused analysis driven by fundamental data. Note that our analysis may not factor in the latest price-sensitive company announcements or qualitative material. Simply Wall St has no position in any stocks mentioned.
About TSE:4222
Kodama Chemical IndustryLtd
Manufactures and sells plastic products in Japan and internationally.
Excellent balance sheet with slight risk.
Market Insights

Advertisement
Community Narratives
America Wants Homegrown Drones — Draganfly Is Ready to Deliver
Fair Value US$9.21|32.6% undervalued
JO
Community Contributor
Cheesecake Factory offers an enticing opportunity for long-term growth by leveraging new concepts
Fair Value US$73.83|25.6% undervalued
ZW
Community Contributor
Coca-Cola’s Intrinsic Value Set to Rise with Fed Rate Cut
Fair Value US$67.50|1.6% undervalued
AL
Community Contributor
Fully Permitted Gold Mine with 50 Baggers Potential 
Fair Value CA$41.00|98.2% undervalued
RO
Community Contributor