
Advertisement
If you are sitting on the fence about UBE stock or weighing whether it deserves a place in your portfolio, you are in good company. Deciding what to do with a stock like UBE takes a blend of gut instinct, context, and cold hard numbers. Over the past year, UBE’s share price has dipped by 9.2%, pulling back on a roughly steady downtrend seen over the past month and year to date. Yet, look further back and the picture shifts. UBE is still up 33.3% over three years and a hefty 52.0% over five years. These longer-term gains give more to think about than just recent volatility or investor nerves.
Much of the recent sentiment seems tied to broad market developments, as investors have re-calibrated their views on cyclical industrial names like UBE. While these short-term moves can feel decisive, they rarely tell the whole story. Instead, valuations offer a clearer perspective for those patient enough to tune out the market noise. In fact, by running UBE through six core valuation checks, we found the company undervalued in four of them, giving it a solid valuation score of 4 out of 6.
So, what do these valuation checks really reveal? In the next sections, we will break down each approach, and later, I will share an even more insightful angle for measuring what UBE is really worth.
Why UBE is lagging behind its peers
Approach 1: UBE Discounted Cash Flow (DCF) Analysis
The Discounted Cash Flow (DCF) model estimates what a company is really worth by projecting its future cash flows and then discounting them back to today's value. This approach puts less weight on near-term market moves and focuses instead on the fundamental earning power of the business.
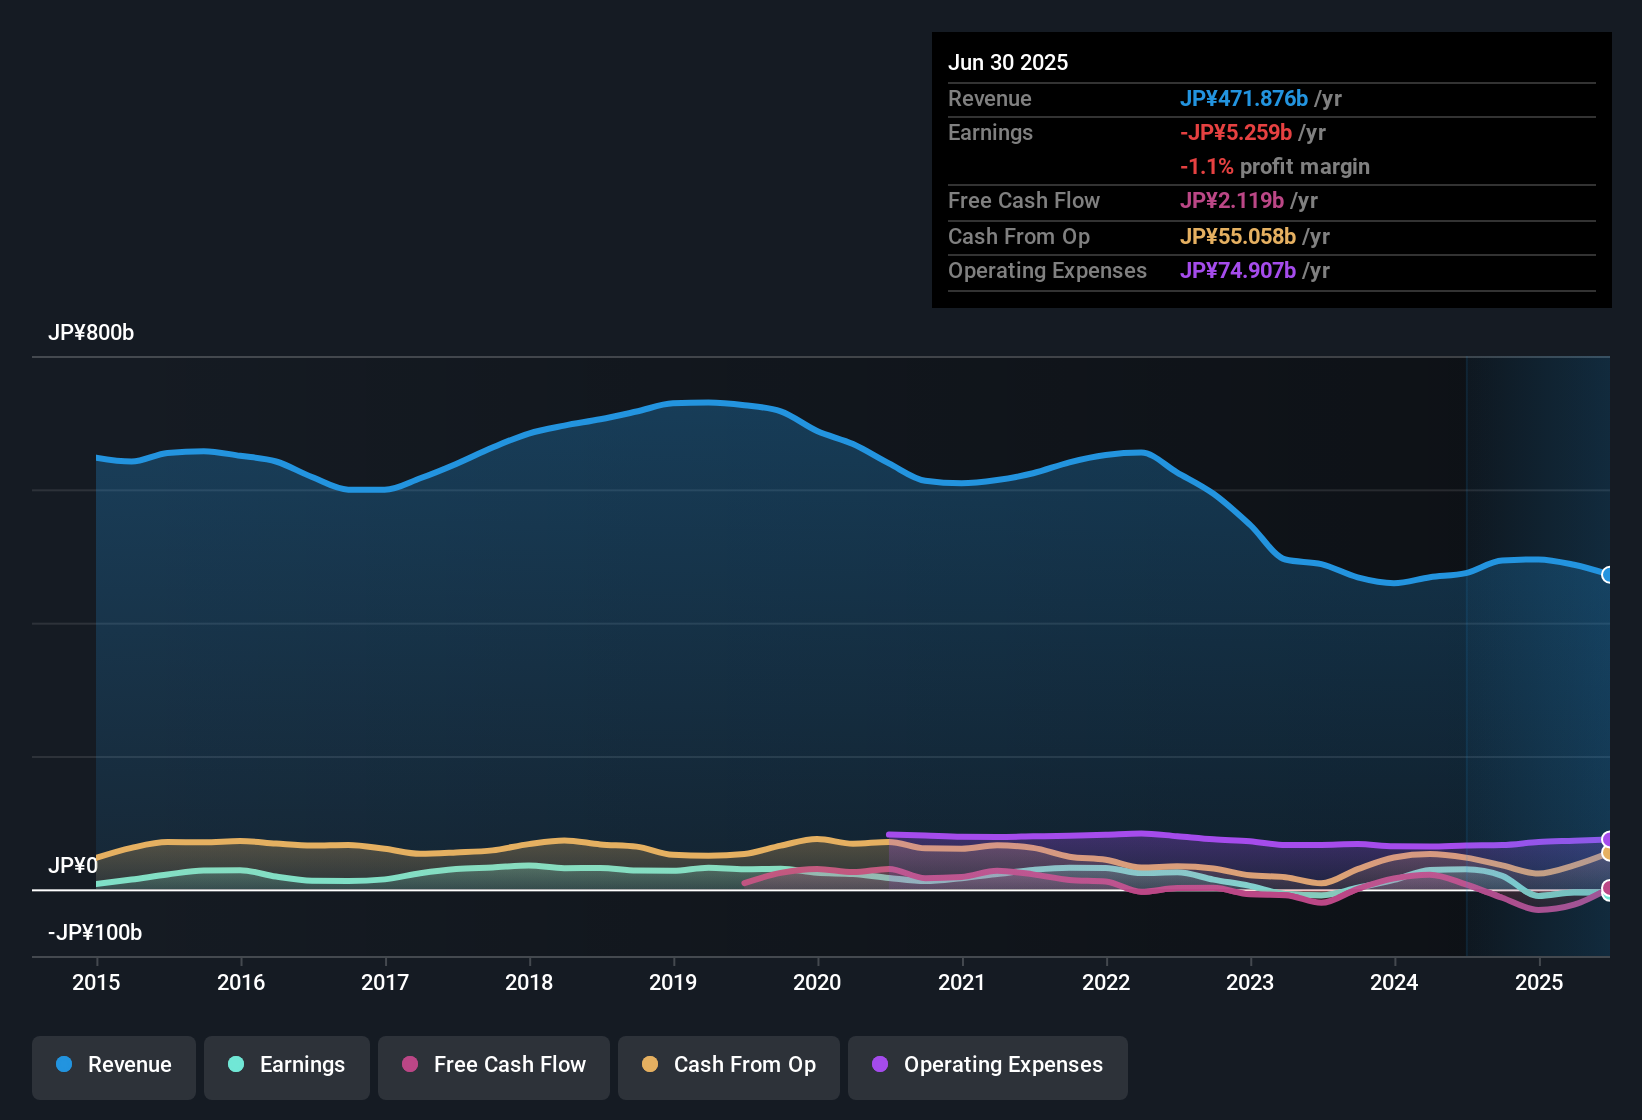
For UBE, the latest reported Free Cash Flow (FCF) is approximately ¥14.8 billion. Analyst projections, which cover the next five years, anticipate significant swings, including both negative and positive cash flows. Within ten years, Simply Wall St's extrapolated estimate sees UBE's annual FCF rising to about ¥22.5 billion. These calculations are performed in Japanese yen (¥), the company’s reporting currency.
Based on this DCF analysis, UBE’s intrinsic value is estimated at ¥1,942 per share. This is 17.5% above the recent share price, suggesting the market currently prices UBE at a premium compared to its fundamental value. In other words, the stock appears somewhat overvalued by this measure.
Result: OVERVALUED
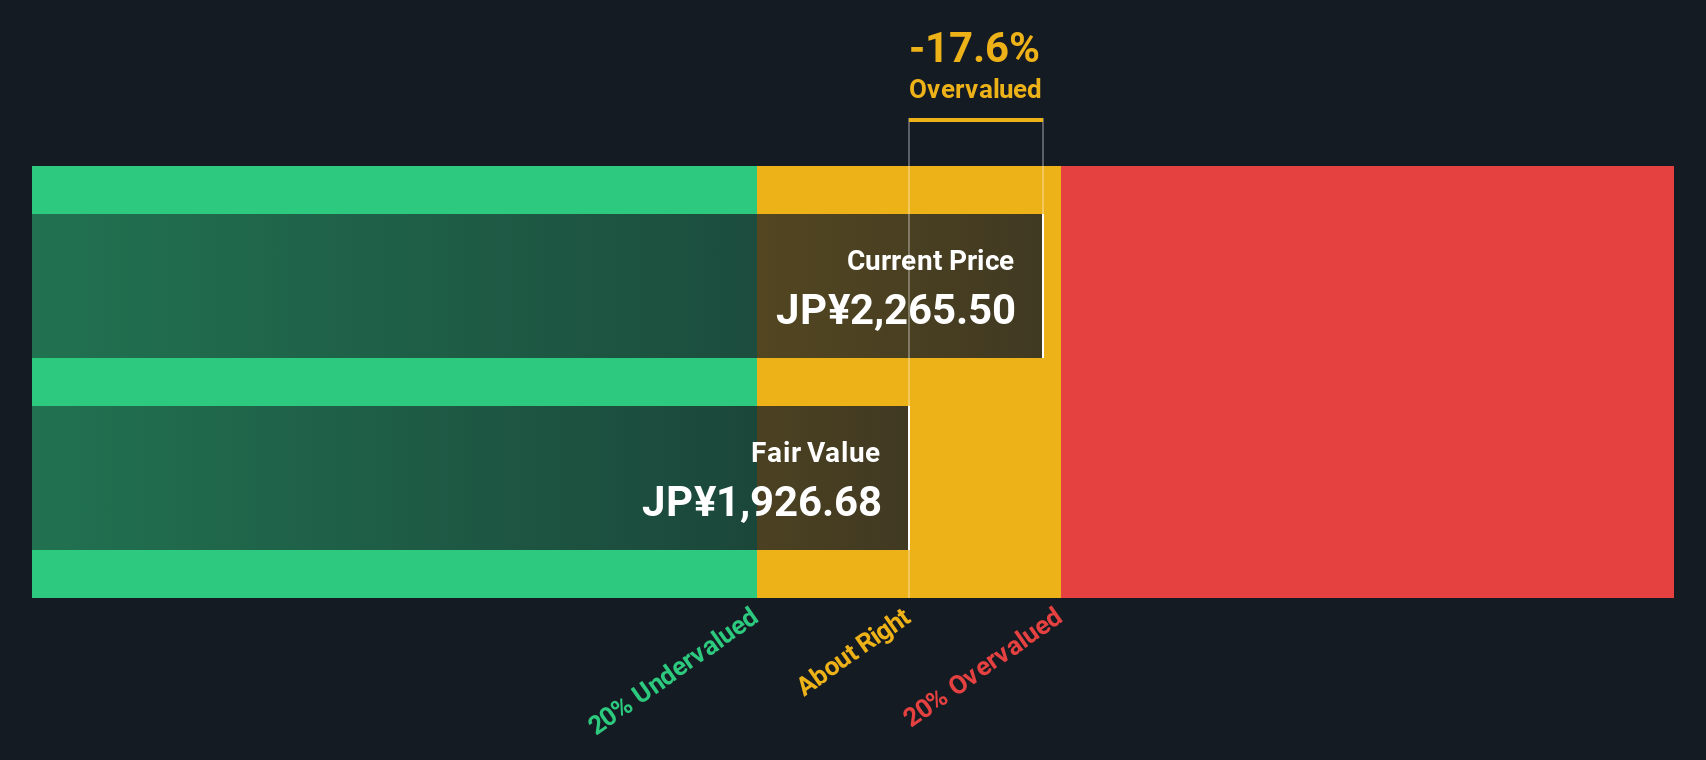
Our Discounted Cash Flow (DCF) analysis suggests UBE may be overvalued by 17.5%. Find undervalued stocks or create your own screener to find better value opportunities.
Approach 2: UBE Price vs Sales (P/S)
The Price-to-Sales (P/S) ratio is often the go-to metric for valuing companies like UBE, especially in the chemicals sector, where profits can swing year to year but sales are relatively steady. The P/S ratio helps investors compare how much they are paying for each unit of a company’s sales, which can be especially useful for firms with volatile or negative earnings.
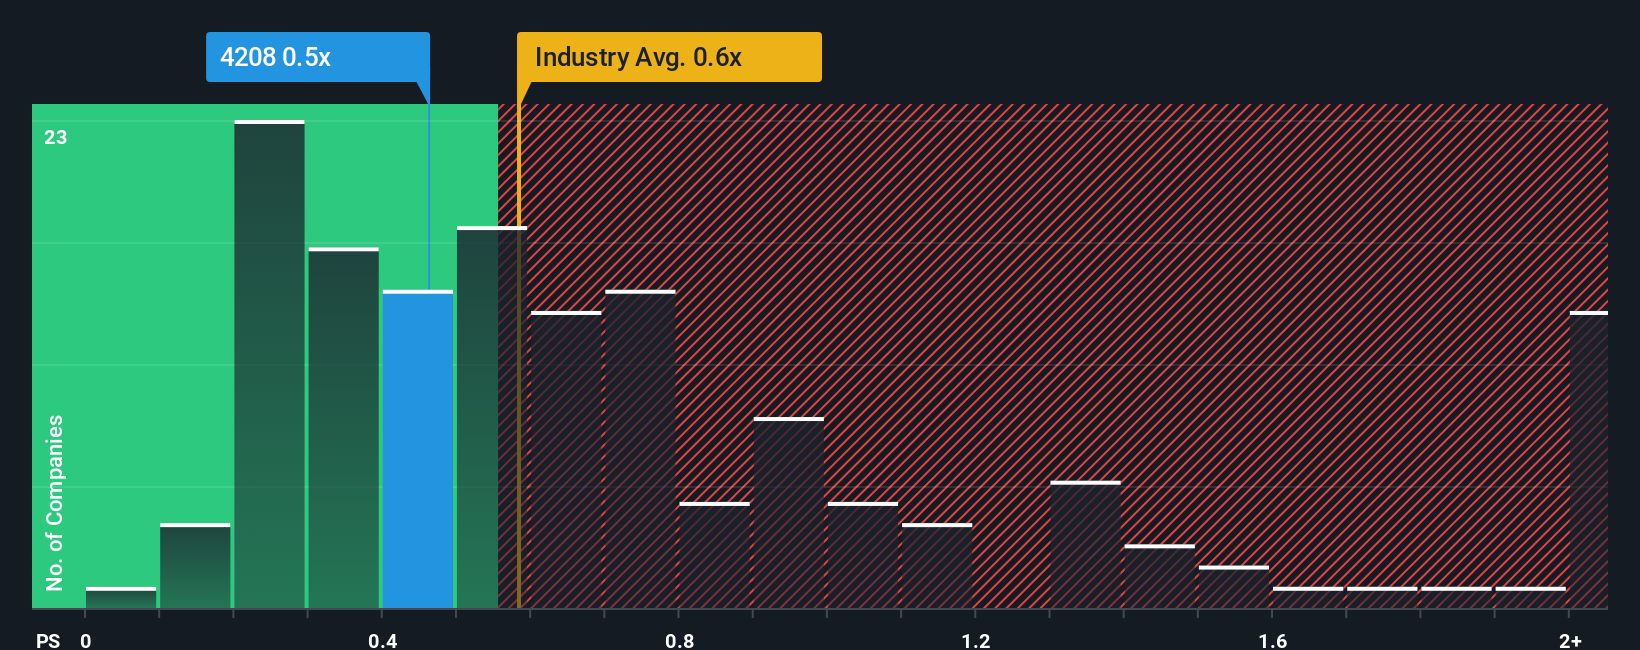
Growth expectations and company-specific risks play a big part in what qualifies as a “normal” P/S ratio. Companies with stronger sales growth or lower risk profiles can justify higher multiples, while slower-growing or riskier businesses usually trade at a discount. UBE is currently trading at a P/S ratio of 0.47x, which is lower than both the industry average (0.60x) and its peer average (0.88x). This suggests UBE’s shares are priced more conservatively than many of its direct competitors.
Simply Wall St introduces the “Fair Ratio,” a tailored benchmark that estimates what a reasonable P/S multiple should be, after considering UBE’s specific growth prospects, industry dynamics, margins, market size, and unique risks. This approach goes beyond basic peer or industry comparisons by offering a more nuanced take. For UBE, the Fair Ratio stands at 0.50x, which is very close to its current 0.47x P/S.
Given this marginal difference, UBE’s valuation by the P/S metric is judged to be about right, and not notably overpriced or cheap, based on its sales fundamentals and business outlook.
Result: ABOUT RIGHT
PS ratios tell one story, but what if the real opportunity lies elsewhere? Discover companies where insiders are betting big on explosive growth.
Upgrade Your Decision Making: Choose your UBE Narrative
Earlier we mentioned that there is an even better way to understand valuation, so let us introduce you to Narratives. A Narrative is essentially your story about a company, a perspective based on your own expectations for its fair value, revenue growth, profit margins, and earnings for the future.
Narratives directly connect the company’s story to concrete financial forecasts, transforming your personal outlook into an estimate of what the business is actually worth. On Simply Wall St’s platform, Narratives are easy to use and found directly on the Community page, where millions of investors share perspectives.
By using Narratives, you get a real-time, visual way to compare your Fair Value estimate against the current market Price, making it easier to decide if UBE aligns with your perspective at the moment. Plus, Narratives automatically update as soon as new information is released, such as earnings results or major news headlines, so your analysis always stays current.
For example, while some investors may see UBE’s upside and set Fair Values above ¥2,500 per share, others with a more cautious view place it under ¥1,500, showing just how different Narratives can be for the very same company.
Do you think there's more to the story for UBE? Create your own Narrative to let the Community know!
This article by Simply Wall St is general in nature. We provide commentary based on historical data and analyst forecasts only using an unbiased methodology and our articles are not intended to be financial advice. It does not constitute a recommendation to buy or sell any stock, and does not take account of your objectives, or your financial situation. We aim to bring you long-term focused analysis driven by fundamental data. Note that our analysis may not factor in the latest price-sensitive company announcements or qualitative material. Simply Wall St has no position in any stocks mentioned.
New: AI Stock Screener & Alerts
Our new AI Stock Screener scans the market every day to uncover opportunities.
• Dividend Powerhouses (3%+ Yield)
• Undervalued Small Caps with Insider Buying
• High growth Tech and AI Companies
Or build your own from over 50 metrics.
Have feedback on this article? Concerned about the content? Get in touch with us directly. Alternatively, email editorial-team@simplywallst.com
About TSE:4208
UBE
Engages in the materials and machinery businesses in Japan, Asia, Europe, and internationally.
Good value with moderate growth potential.
Similar Companies
Market Insights

Advertisement
Community Narratives
The Next Phase of Energy Storage: How NeoVolta Is Tackling America’s Power Crunch
Fair Value US$7.50|30.4% undervalued
MA
Community Contributor
A formidable player in AI and enterprise computing.
Fair Value US$210.00|3.0% undervalued
CO
Community Contributor
IREN's Bold Moves in Sustainable Bitcoin Mining & AI Data Centers
Fair Value US$72.52|20.4% undervalued
BL
Community Contributor
Cooling the Champions: The Aussie Tech Behind F1's Victories
Fair Value AU$12.40|38.1% undervalued
TR
Community Contributor