
Advertisement
These 4 Measures Indicate That Osaka Soda (TSE:4046) Is Using Debt Reasonably Well
The external fund manager backed by Berkshire Hathaway's Charlie Munger, Li Lu, makes no bones about it when he says 'The biggest investment risk is not the volatility of prices, but whether you will suffer a permanent loss of capital.' It's only natural to consider a company's balance sheet when you examine how risky it is, since debt is often involved when a business collapses. We can see that Osaka Soda Co., Ltd. (TSE:4046) does use debt in its business. But should shareholders be worried about its use of debt?
When Is Debt Dangerous?
Debt and other liabilities become risky for a business when it cannot easily fulfill those obligations, either with free cash flow or by raising capital at an attractive price. Part and parcel of capitalism is the process of 'creative destruction' where failed businesses are mercilessly liquidated by their bankers. However, a more usual (but still expensive) situation is where a company must dilute shareholders at a cheap share price simply to get debt under control. Of course, plenty of companies use debt to fund growth, without any negative consequences. The first thing to do when considering how much debt a business uses is to look at its cash and debt together.
Check out our latest analysis for Osaka Soda
What Is Osaka Soda's Net Debt?
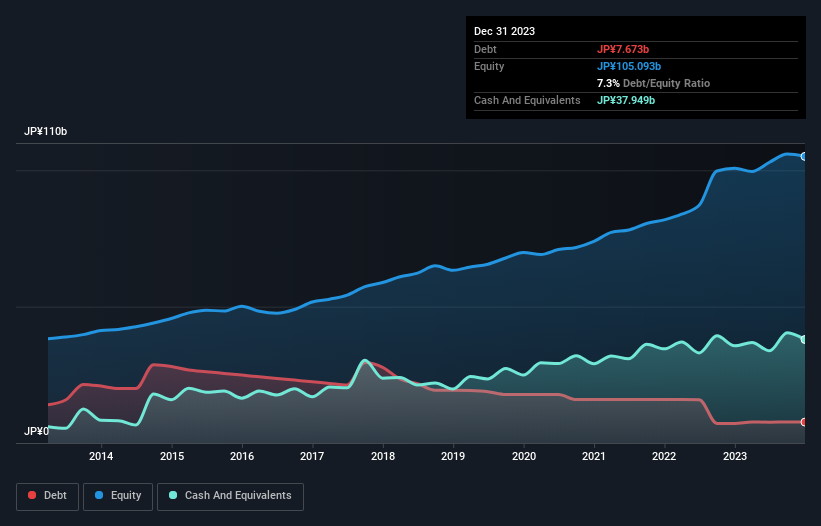
The image below, which you can click on for greater detail, shows that at December 2023 Osaka Soda had debt of JP¥7.67b, up from JP¥7.17b in one year. However, it does have JP¥37.9b in cash offsetting this, leading to net cash of JP¥30.3b.
How Healthy Is Osaka Soda's Balance Sheet?
Zooming in on the latest balance sheet data, we can see that Osaka Soda had liabilities of JP¥32.4b due within 12 months and liabilities of JP¥7.17b due beyond that. Offsetting these obligations, it had cash of JP¥37.9b as well as receivables valued at JP¥35.3b due within 12 months. So it can boast JP¥33.7b more liquid assets than total liabilities.
This short term liquidity is a sign that Osaka Soda could probably pay off its debt with ease, as its balance sheet is far from stretched. Simply put, the fact that Osaka Soda has more cash than debt is arguably a good indication that it can manage its debt safely.
It is just as well that Osaka Soda's load is not too heavy, because its EBIT was down 44% over the last year. Falling earnings (if the trend continues) could eventually make even modest debt quite risky. When analysing debt levels, the balance sheet is the obvious place to start. But ultimately the future profitability of the business will decide if Osaka Soda can strengthen its balance sheet over time. So if you want to see what the professionals think, you might find this free report on analyst profit forecasts to be interesting.
But our final consideration is also important, because a company cannot pay debt with paper profits; it needs cold hard cash. While Osaka Soda has net cash on its balance sheet, it's still worth taking a look at its ability to convert earnings before interest and tax (EBIT) to free cash flow, to help us understand how quickly it is building (or eroding) that cash balance. Looking at the most recent three years, Osaka Soda recorded free cash flow of 44% of its EBIT, which is weaker than we'd expect. That's not great, when it comes to paying down debt.
Summing Up
While we empathize with investors who find debt concerning, you should keep in mind that Osaka Soda has net cash of JP¥30.3b, as well as more liquid assets than liabilities. So we don't have any problem with Osaka Soda's use of debt. There's no doubt that we learn most about debt from the balance sheet. However, not all investment risk resides within the balance sheet - far from it. We've identified 2 warning signs with Osaka Soda , and understanding them should be part of your investment process.
If, after all that, you're more interested in a fast growing company with a rock-solid balance sheet, then check out our list of net cash growth stocks without delay.
New: AI Stock Screener & Alerts
Our new AI Stock Screener scans the market every day to uncover opportunities.
• Dividend Powerhouses (3%+ Yield)
• Undervalued Small Caps with Insider Buying
• High growth Tech and AI Companies
Or build your own from over 50 metrics.
Have feedback on this article? Concerned about the content? Get in touch with us directly. Alternatively, email editorial-team (at) simplywallst.com.
This article by Simply Wall St is general in nature. We provide commentary based on historical data and analyst forecasts only using an unbiased methodology and our articles are not intended to be financial advice. It does not constitute a recommendation to buy or sell any stock, and does not take account of your objectives, or your financial situation. We aim to bring you long-term focused analysis driven by fundamental data. Note that our analysis may not factor in the latest price-sensitive company announcements or qualitative material. Simply Wall St has no position in any stocks mentioned.
About TSE:4046
Osaka Soda
Manufactures and sells basic and functional products in Asia, Europe, North America, and internationally.
Flawless balance sheet with solid track record.
Similar Companies
Market Insights

Advertisement
Community Narratives
The Next Phase of Energy Storage: How NeoVolta Is Tackling America’s Power Crunch
Fair Value US$7.50|30.4% undervalued
MA
Community Contributor
A formidable player in AI and enterprise computing.
Fair Value US$210.00|3.0% undervalued
CO
Community Contributor
IREN's Bold Moves in Sustainable Bitcoin Mining & AI Data Centers
Fair Value US$72.52|20.4% undervalued
BL
Community Contributor
Cooling the Champions: The Aussie Tech Behind F1's Victories
Fair Value AU$12.40|38.1% undervalued
TR
Community Contributor