Advertisement
- Japan
- /
- Specialty Stores
- /
- TSE:9990
Nissan Chemical And 2 Other Top Dividend Stocks On The Tokyo Exchange

Simply Wall St
Reviewed by Simply Wall St
Japan's stock markets have experienced a notable rise recently, with the Nikkei 225 Index gaining momentum amid yen weakness, which has improved the profit outlook for exporters. As investors navigate this favorable backdrop, dividend stocks like Nissan Chemical and others on the Tokyo Exchange present compelling opportunities for those seeking stable income in a dynamic market environment.
Top 10 Dividend Stocks In Japan
| Name | Dividend Yield | Dividend Rating |
| Tsubakimoto Chain (TSE:6371) | 4.15% | ★★★★★★ |
| Globeride (TSE:7990) | 4.18% | ★★★★★★ |
| Yamato Kogyo (TSE:5444) | 4.13% | ★★★★★★ |
| Intelligent Wave (TSE:4847) | 3.97% | ★★★★★★ |
| KurimotoLtd (TSE:5602) | 5.28% | ★★★★★★ |
| Innotech (TSE:9880) | 4.83% | ★★★★★★ |
| CAC Holdings (TSE:4725) | 4.54% | ★★★★★★ |
| Business Brain Showa-Ota (TSE:9658) | 4.24% | ★★★★★★ |
| FALCO HOLDINGS (TSE:4671) | 6.27% | ★★★★★★ |
| GakkyushaLtd (TSE:9769) | 4.50% | ★★★★★★ |
Click here to see the full list of 447 stocks from our Top Japanese Dividend Stocks screener.
We'll examine a selection from our screener results.
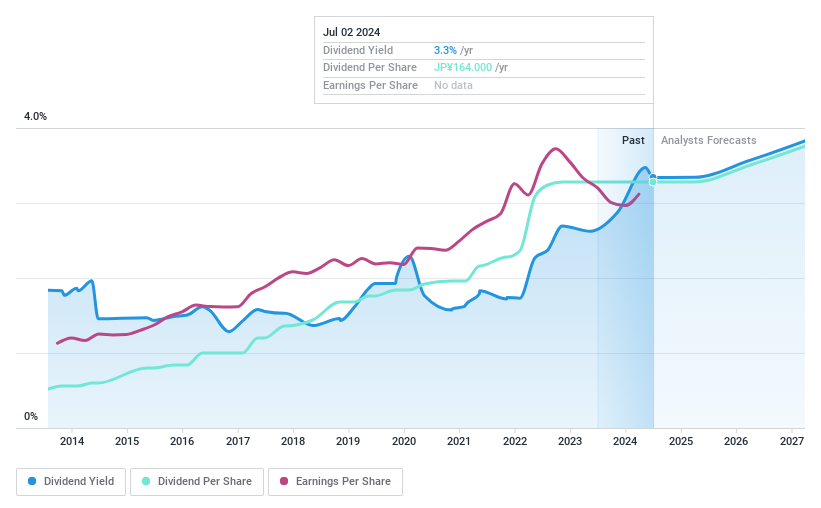
Nissan Chemical (TSE:4021)
Simply Wall St Dividend Rating: ★★★★☆☆
Overview: Nissan Chemical Corporation operates in the chemicals, performance materials, agricultural chemicals, and pharmaceuticals sectors both in Japan and internationally, with a market cap of ¥733.09 billion.
Operations: Nissan Chemical Corporation generates revenue primarily from its Trading segment at ¥106.95 billion, followed by Performance Materials at ¥87.24 billion, Agricultural Chemicals at ¥83.67 billion, Chemicals at ¥35.36 billion, and Healthcare at ¥5.82 billion.
Dividend Yield: 3.1%
Nissan Chemical's dividend reliability is underscored by a decade of stable and growing payments, though the 3.08% yield is modest compared to top Japanese payers. Recent board meetings focused on share repurchase and treasury share cancellation, potentially impacting future dividends. Despite a reasonable payout ratio of 61%, dividends are not well covered by cash flows, with a high cash payout ratio of 113%, raising concerns about sustainability without improved free cash flow coverage.
- Click here and access our complete dividend analysis report to understand the dynamics of Nissan Chemical.
- In light of our recent valuation report, it seems possible that Nissan Chemical is trading beyond its estimated value.
Riken Technos (TSE:4220)
Simply Wall St Dividend Rating: ★★★★☆☆
Overview: Riken Technos Corporation operates in the compound, film, and food wrapping film sectors both in Japan and internationally, with a market capitalization of ¥58.34 billion.
Operations: Riken Technos Corporation's revenue is derived from four primary segments: Electronics (¥24.59 billion), Transportation (¥40.88 billion), Daily Life & Healthcare (¥34.24 billion), and Building & Construction (¥26.24 billion).
Dividend Yield: 3.1%
Riken Technos' dividend sustainability is supported by low payout ratios, with earnings and cash flow coverage at 25.2% and 27.6%, respectively. However, its dividend reliability is questionable due to a volatile payment history over the past decade, despite recent growth. A share buyback program aims to enhance shareholder returns and capital efficiency by repurchasing up to ¥3 billion in shares, potentially influencing future dividends positively amidst an expected decline in earnings growth.
- Dive into the specifics of Riken Technos here with our thorough dividend report.
- The analysis detailed in our Riken Technos valuation report hints at an deflated share price compared to its estimated value.
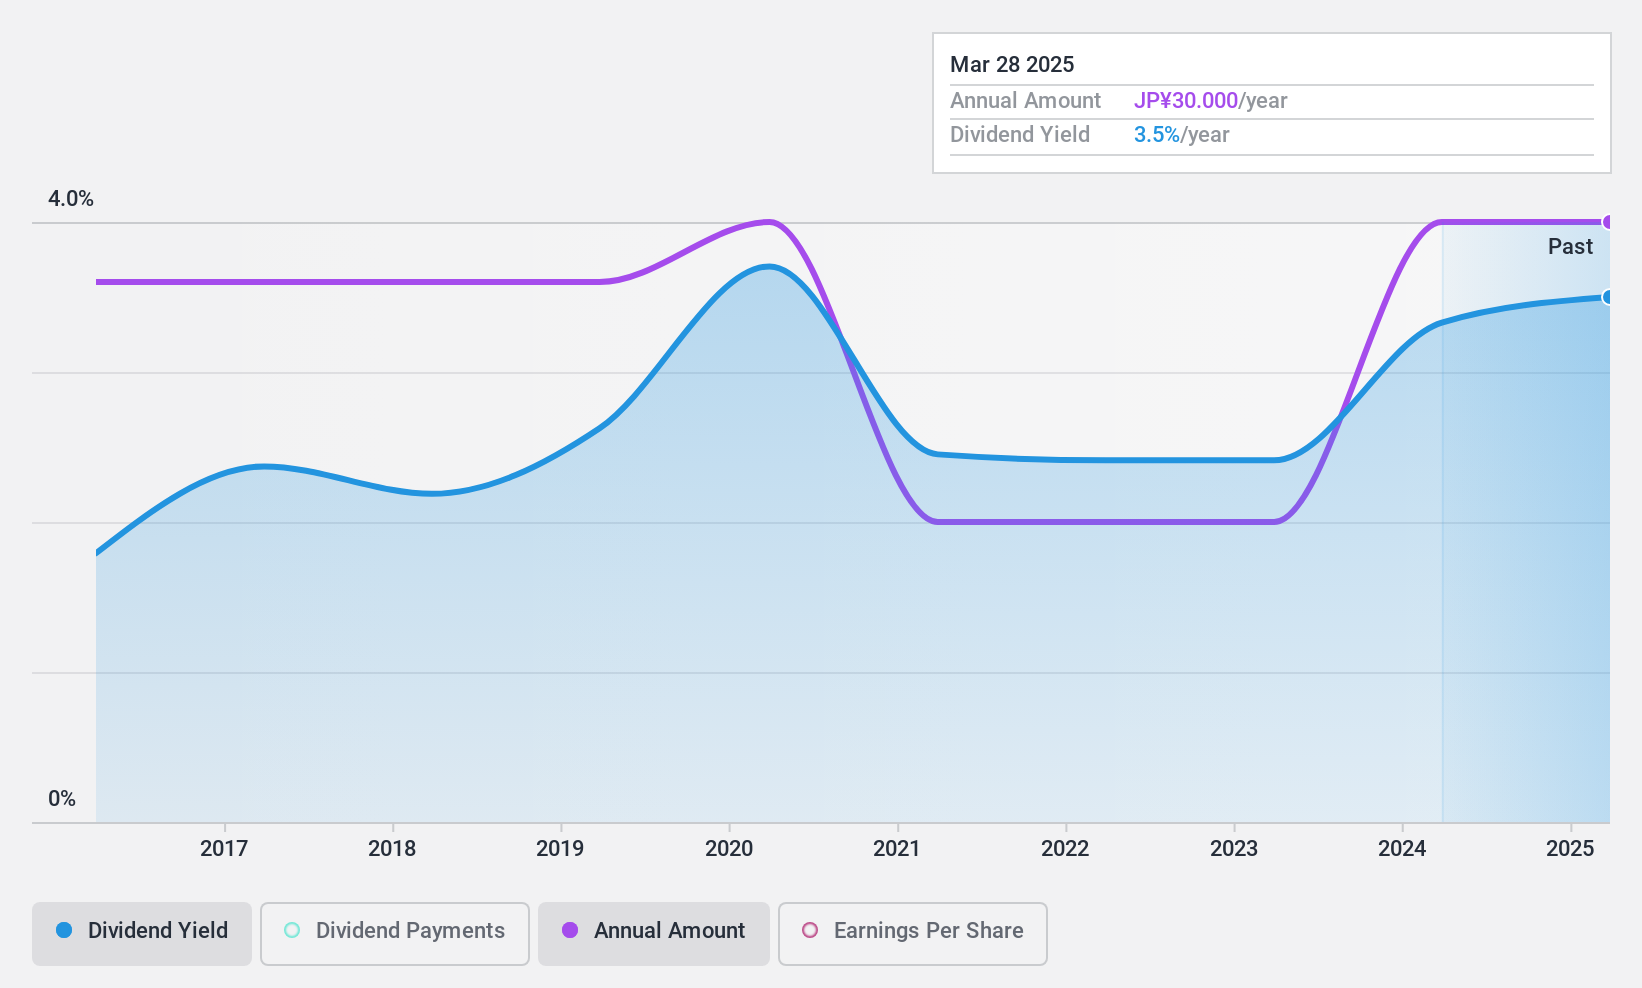
Sac's Bar Holdings (TSE:9990)
Simply Wall St Dividend Rating: ★★★★☆☆
Overview: Sac's Bar Holdings Inc. operates in Japan, focusing on the retail sale of bags, fashion goods, and related accessories with a market cap of ¥26.03 billion.
Operations: Sac's Bar Holdings Inc. generates revenue primarily from product sales, centering on bags and pouches, totaling ¥51.97 billion.
Dividend Yield: 3.3%
Sac's Bar Holdings maintains a stable dividend of ¥30 per share for the fiscal year ending March 2025, despite its history of volatility and unreliability over the past decade. The company's dividends are well-supported by earnings and cash flows, with payout ratios at 35.1% and 19.1%, respectively. While trading significantly below estimated fair value, Sac's Bar Holdings has shown substantial earnings growth of 49.8% in the past year, bolstering its dividend coverage.
- Unlock comprehensive insights into our analysis of Sac's Bar Holdings stock in this dividend report.
- Our expertly prepared valuation report Sac's Bar Holdings implies its share price may be lower than expected.
Make It Happen
- Explore the 447 names from our Top Japanese Dividend Stocks screener here.
- Have you diversified into these companies? Leverage the power of Simply Wall St's portfolio to keep a close eye on market movements affecting your investments.
- Discover a world of investment opportunities with Simply Wall St's free app and access unparalleled stock analysis across all markets.
Contemplating Other Strategies?
- Explore high-performing small cap companies that haven't yet garnered significant analyst attention.
- Fuel your portfolio with companies showing strong growth potential, backed by optimistic outlooks both from analysts and management.
- Find companies with promising cash flow potential yet trading below their fair value.
This article by Simply Wall St is general in nature. We provide commentary based on historical data and analyst forecasts only using an unbiased methodology and our articles are not intended to be financial advice. It does not constitute a recommendation to buy or sell any stock, and does not take account of your objectives, or your financial situation. We aim to bring you long-term focused analysis driven by fundamental data. Note that our analysis may not factor in the latest price-sensitive company announcements or qualitative material. Simply Wall St has no position in any stocks mentioned.
New: Manage All Your Stock Portfolios in One Place
We've created the ultimate portfolio companion for stock investors, and it's free.
• Connect an unlimited number of Portfolios and see your total in one currency
• Be alerted to new Warning Signs or Risks via email or mobile
• Track the Fair Value of your stocks
Have feedback on this article? Concerned about the content? Get in touch with us directly. Alternatively, email editorial-team@simplywallst.com
About TSE:9990
Sac's Bar Holdings
Engages in the retail sale of bags, fashion goods, and related accessories in Japan.
Flawless balance sheet, good value and pays a dividend.
Market Insights

Advertisement
Community Narratives
Scaling up in building materials with smart M&A and growing profitability
Fair Value US$2.77|30.0% undervalued
CM
Community Contributor
Hims: The Platform Powering Personalised Healthcare
Fair Value US$114.01|51.9% undervalued
BL
Community Contributor
Undervalued lottery company with strong fundamentals
Fair Value AU$15.00|34.5% undervalued
RO
Community Contributor
Proximus, transferring money from the impatient to the patient investor
Fair Value €16.62|55.1% undervalued
AX
Community Contributor