
Advertisement
- Japan
- /
- Personal Products
- /
- TSE:7806
MTG's (TSE:7806) 55% CAGR outpaced the company's earnings growth over the same three-year period
It might seem bad, but the worst that can happen when you buy a stock (without leverage) is that its share price goes to zero. But in contrast you can make much more than 100% if the company does well. To wit, the MTG Co., Ltd. (TSE:7806) share price has flown 264% in the last three years. Most would be happy with that. In more good news, the share price has risen 18% in thirty days. We note that MTG reported its financial results recently; luckily, you can catch up on the latest revenue and profit numbers in our company report.
On the back of a solid 7-day performance, let's check what role the company's fundamentals have played in driving long term shareholder returns.
While markets are a powerful pricing mechanism, share prices reflect investor sentiment, not just underlying business performance. One way to examine how market sentiment has changed over time is to look at the interaction between a company's share price and its earnings per share (EPS).
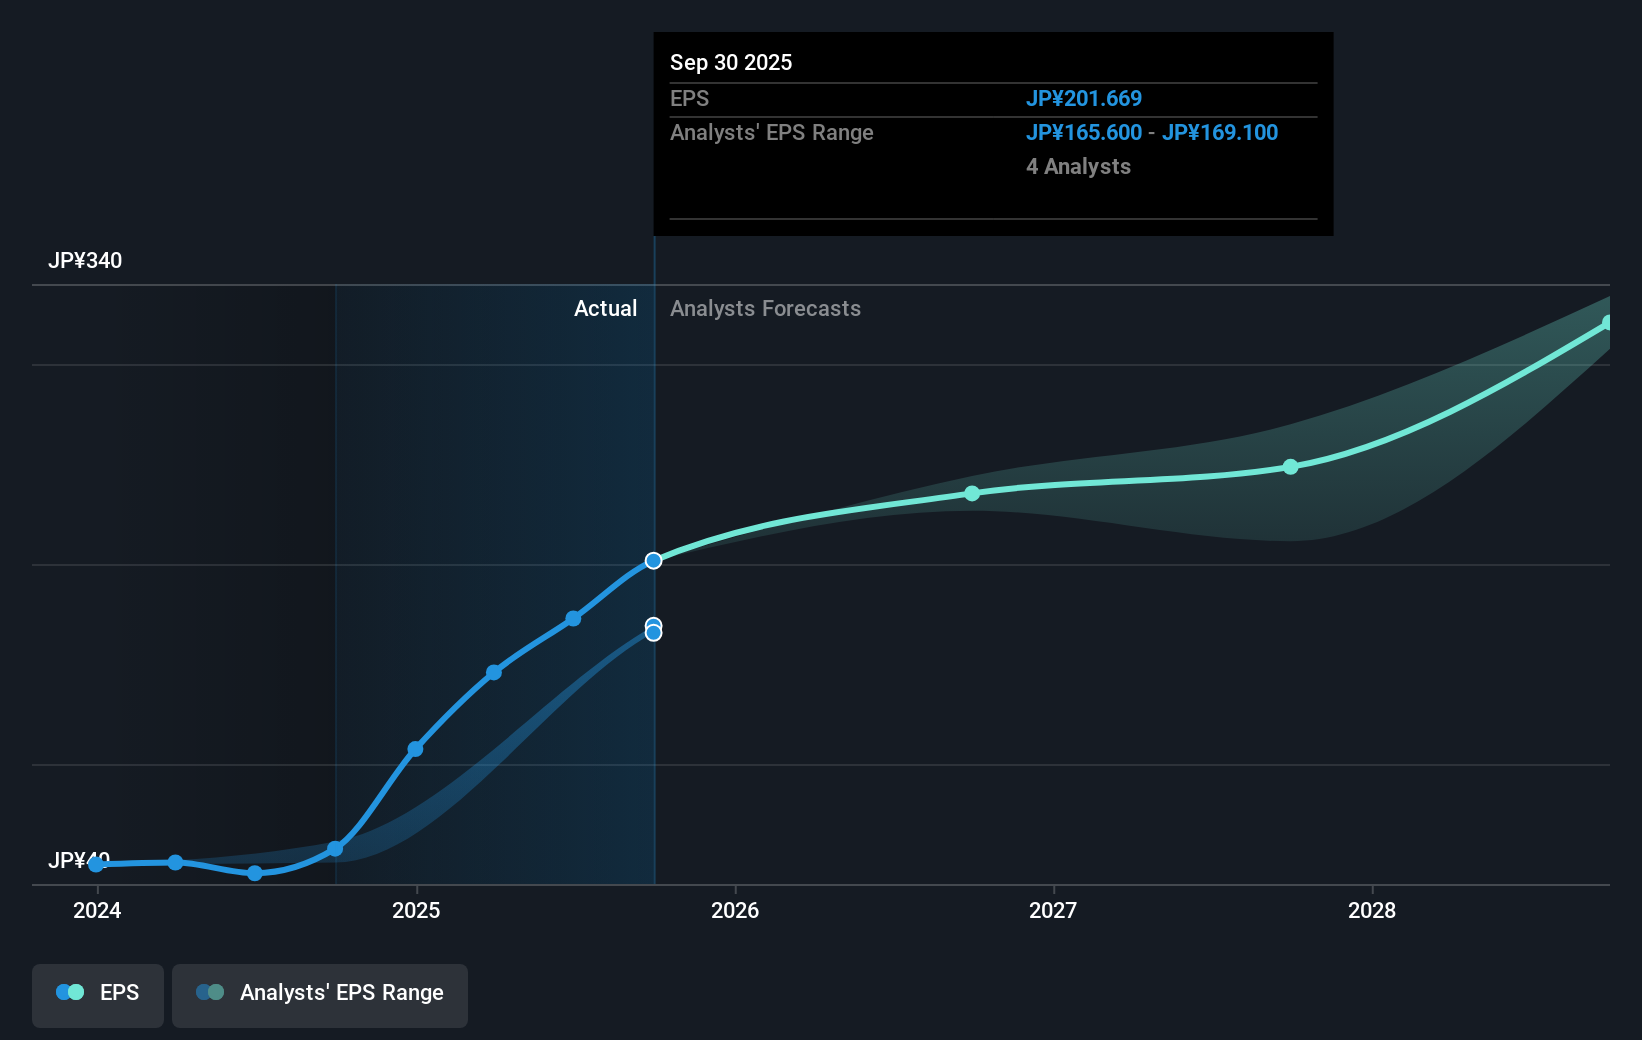
MTG was able to grow its EPS at 43% per year over three years, sending the share price higher. We don't think it is entirely coincidental that the EPS growth is reasonably close to the 54% average annual increase in the share price. That suggests that the market sentiment around the company hasn't changed much over that time. Au contraire, the share price change has arguably mimicked the EPS growth.
You can see below how EPS has changed over time (discover the exact values by clicking on the image).
We know that MTG has improved its bottom line over the last three years, but what does the future have in store? Take a more thorough look at MTG's financial health with this free report on its balance sheet.
What About Dividends?
It is important to consider the total shareholder return, as well as the share price return, for any given stock. Whereas the share price return only reflects the change in the share price, the TSR includes the value of dividends (assuming they were reinvested) and the benefit of any discounted capital raising or spin-off. So for companies that pay a generous dividend, the TSR is often a lot higher than the share price return. As it happens, MTG's TSR for the last 3 years was 271%, which exceeds the share price return mentioned earlier. This is largely a result of its dividend payments!
A Different Perspective
We're pleased to report that MTG shareholders have received a total shareholder return of 116% over one year. That's including the dividend. Since the one-year TSR is better than the five-year TSR (the latter coming in at 29% per year), it would seem that the stock's performance has improved in recent times. In the best case scenario, this may hint at some real business momentum, implying that now could be a great time to delve deeper. It's always interesting to track share price performance over the longer term. But to understand MTG better, we need to consider many other factors. Take risks, for example - MTG has 2 warning signs we think you should be aware of.
We will like MTG better if we see some big insider buys. While we wait, check out this free list of undervalued stocks (mostly small caps) with considerable, recent, insider buying.
Please note, the market returns quoted in this article reflect the market weighted average returns of stocks that currently trade on Japanese exchanges.
New: Manage All Your Stock Portfolios in One Place
We've created the ultimate portfolio companion for stock investors, and it's free.
• Connect an unlimited number of Portfolios and see your total in one currency
• Be alerted to new Warning Signs or Risks via email or mobile
• Track the Fair Value of your stocks
Have feedback on this article? Concerned about the content? Get in touch with us directly. Alternatively, email editorial-team (at) simplywallst.com.
This article by Simply Wall St is general in nature. We provide commentary based on historical data and analyst forecasts only using an unbiased methodology and our articles are not intended to be financial advice. It does not constitute a recommendation to buy or sell any stock, and does not take account of your objectives, or your financial situation. We aim to bring you long-term focused analysis driven by fundamental data. Note that our analysis may not factor in the latest price-sensitive company announcements or qualitative material. Simply Wall St has no position in any stocks mentioned.
About TSE:7806
MTG
Manufactures and sells health, beauty, and wellness products in Japan and internationally.
Undervalued with excellent balance sheet.
Market Insights

Advertisement
Weekly Picks
RO


RockeTeller on Santacruz Silver Mining ·
Crazy Undervalued 42 Baggers Silver Play (Active & Running Mine)
Fair Value:CA$8696.6% undervalued
8 followersusers have followed this narrative
5 commentsusers have commented on this narrative
0 likesusers have liked this narrative
RO


Robbo on Fiducian Group ·
Fiducian: Compliance Clouds or Value Opportunity?
Fair Value:AU$126.3% undervalued
1 followerusers have followed this narrative
0 commentsusers have commented on this narrative
0 likesusers have liked this narrative
WO

woodworthfund on Willamette Valley Vineyards ·
Willamette Valley Vineyards (WVVI): Not-So-Great Value
Fair Value:US$246.4% overvalued
2 followersusers have followed this narrative
0 commentsusers have commented on this narrative
1 likeusers have liked this narrative
Recently Updated Narratives
TA


Talos on Marvell Technology ·
The Great Strategy Swap – Selling "Old Auto" to Buy "Future Light"
Fair Value:US$155.3741.4% undervalued
1 followerusers have followed this narrative
0 commentsusers have commented on this narrative
0 likesusers have liked this narrative
TA

Talos on NVIDIA ·
Not a Bubble, But the "Industrial Revolution 4.0" Engine
Fair Value:US$294.9239.0% undervalued
3 followersusers have followed this narrative
0 commentsusers have commented on this narrative
0 likesusers have liked this narrative
TA

Talos on Advanced Micro Devices ·
The "David vs. Goliath" AI Trade – Why Second Place is Worth Billions
Fair Value:US$416.4647.2% undervalued
2 followersusers have followed this narrative
0 commentsusers have commented on this narrative
0 likesusers have liked this narrative
Popular Narratives
TH


TheWallstreetKing on MicroVision ·
MicroVision will explode future revenue by 380.37% with a vision towards success
Fair Value:US$6098.6% undervalued
112 followersusers have followed this narrative
11 commentsusers have commented on this narrative
22 likesusers have liked this narrative
AN

AnalystConsensusTarget on NVIDIA ·
NVDA: Expanding AI Demand Will Drive Major Data Center Investments Through 2026
Fair Value:US$250.3928.1% undervalued
946 followersusers have followed this narrative
6 commentsusers have commented on this narrative
24 likesusers have liked this narrative
OS


oscargarcia on Alphabet ·
The company that turned a verb into a global necessity and basically runs the modern internet, digital ads, smartphones, maps, and AI.
Fair Value:US$3407.4% undervalued
147 followersusers have followed this narrative
6 commentsusers have commented on this narrative
18 likesusers have liked this narrative