- Japan
- /
- Personal Products
- /
- TSE:4931
Shinnihonseiyaku Second Quarter 2025 Earnings: JP¥4.77 loss per share (vs JP¥28.71 profit in 2Q 2024)


Shinnihonseiyaku (TSE:4931) Second Quarter 2025 Results
Key Financial Results
- Revenue: JP¥9.81b (up 1.0% from 2Q 2024).
- Net loss: JP¥101.0m (down by 116% from JP¥619.0m profit in 2Q 2024).
- JP¥4.77 loss per share (down from JP¥28.71 profit in 2Q 2024).
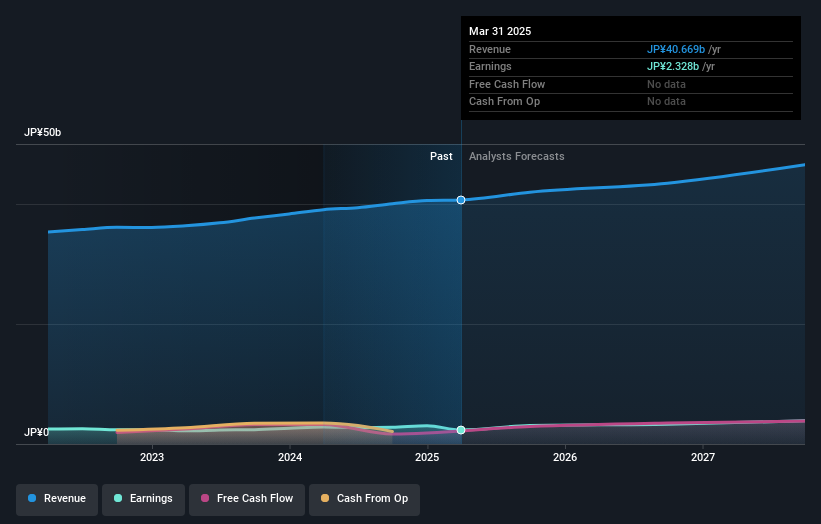
All figures shown in the chart above are for the trailing 12 month (TTM) period
Shinnihonseiyaku Earnings Insights
Looking ahead, revenue is forecast to grow 5.0% p.a. on average during the next 3 years, compared to a 3.9% growth forecast for the Personal Products industry in Japan.
Performance of the Japanese Personal Products industry.
The company's shares are down 7.8% from a week ago.
Balance Sheet Analysis
While it's very important to consider the profit and loss statement, you can also learn a lot about a company by looking at its balance sheet. We have a graphic representation of Shinnihonseiyaku's balance sheet and an in-depth analysis of the company's financial position.
If you're looking to trade Shinnihonseiyaku, open an account with the lowest-cost platform trusted by professionals, Interactive Brokers.
With clients in over 200 countries and territories, and access to 160 markets, IBKR lets you trade stocks, options, futures, forex, bonds and funds from a single integrated account.
Enjoy no hidden fees, no account minimums, and FX conversion rates as low as 0.03%, far better than what most brokers offer.
Sponsored ContentNew: Manage All Your Stock Portfolios in One Place
We've created the ultimate portfolio companion for stock investors, and it's free.
• Connect an unlimited number of Portfolios and see your total in one currency
• Be alerted to new Warning Signs or Risks via email or mobile
• Track the Fair Value of your stocks
Have feedback on this article? Concerned about the content? Get in touch with us directly. Alternatively, email editorial-team (at) simplywallst.com.
This article by Simply Wall St is general in nature. We provide commentary based on historical data and analyst forecasts only using an unbiased methodology and our articles are not intended to be financial advice. It does not constitute a recommendation to buy or sell any stock, and does not take account of your objectives, or your financial situation. We aim to bring you long-term focused analysis driven by fundamental data. Note that our analysis may not factor in the latest price-sensitive company announcements or qualitative material. Simply Wall St has no position in any stocks mentioned.
About TSE:4931
Shinnihonseiyaku
Provides cosmetics, pharmaceuticals, and health food in Japan and internationally.
Flawless balance sheet and undervalued.
Market Insights

Community Narratives


