
Advertisement

Legendary fund manager Li Lu (who Charlie Munger backed) once said, 'The biggest investment risk is not the volatility of prices, but whether you will suffer a permanent loss of capital.' It's only natural to consider a company's balance sheet when you examine how risky it is, since debt is often involved when a business collapses. Importantly, Fancl Corporation (TSE:4921) does carry debt. But is this debt a concern to shareholders?
When Is Debt A Problem?
Debt and other liabilities become risky for a business when it cannot easily fulfill those obligations, either with free cash flow or by raising capital at an attractive price. If things get really bad, the lenders can take control of the business. However, a more common (but still painful) scenario is that it has to raise new equity capital at a low price, thus permanently diluting shareholders. Having said that, the most common situation is where a company manages its debt reasonably well - and to its own advantage. The first thing to do when considering how much debt a business uses is to look at its cash and debt together.
See our latest analysis for Fancl
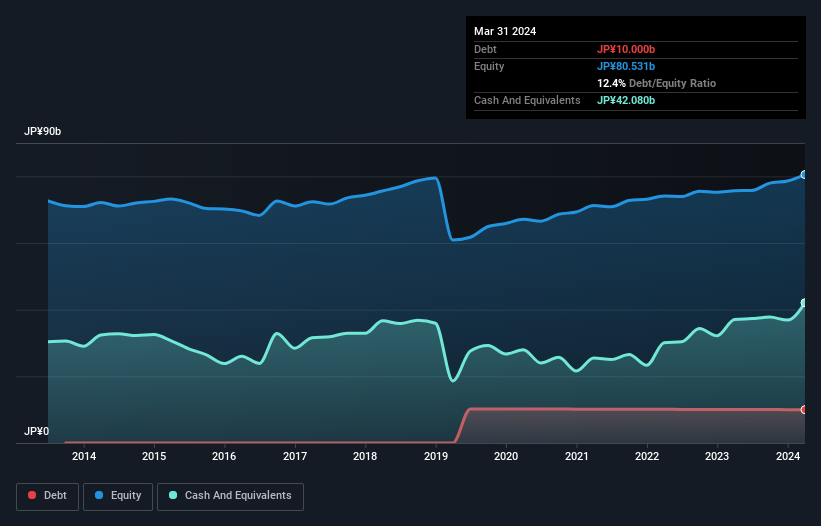
What Is Fancl's Net Debt?
The chart below, which you can click on for greater detail, shows that Fancl had JP¥10.0b in debt in March 2024; about the same as the year before. However, its balance sheet shows it holds JP¥42.1b in cash, so it actually has JP¥32.1b net cash.
How Healthy Is Fancl's Balance Sheet?
We can see from the most recent balance sheet that Fancl had liabilities of JP¥28.3b falling due within a year, and liabilities of JP¥1.93b due beyond that. Offsetting these obligations, it had cash of JP¥42.1b as well as receivables valued at JP¥14.2b due within 12 months. So it can boast JP¥26.1b more liquid assets than total liabilities.
This surplus suggests that Fancl has a conservative balance sheet, and could probably eliminate its debt without much difficulty. Succinctly put, Fancl boasts net cash, so it's fair to say it does not have a heavy debt load!
On top of that, Fancl grew its EBIT by 61% over the last twelve months, and that growth will make it easier to handle its debt. There's no doubt that we learn most about debt from the balance sheet. But it is future earnings, more than anything, that will determine Fancl's ability to maintain a healthy balance sheet going forward. So if you're focused on the future you can check out this free report showing analyst profit forecasts.
But our final consideration is also important, because a company cannot pay debt with paper profits; it needs cold hard cash. Fancl may have net cash on the balance sheet, but it is still interesting to look at how well the business converts its earnings before interest and tax (EBIT) to free cash flow, because that will influence both its need for, and its capacity to manage debt. Over the last three years, Fancl recorded free cash flow worth a fulsome 90% of its EBIT, which is stronger than we'd usually expect. That positions it well to pay down debt if desirable to do so.
Summing Up
While we empathize with investors who find debt concerning, you should keep in mind that Fancl has net cash of JP¥32.1b, as well as more liquid assets than liabilities. And it impressed us with free cash flow of JP¥8.3b, being 90% of its EBIT. So is Fancl's debt a risk? It doesn't seem so to us. Above most other metrics, we think its important to track how fast earnings per share is growing, if at all. If you've also come to that realization, you're in luck, because today you can view this interactive graph of Fancl's earnings per share history for free.
If, after all that, you're more interested in a fast growing company with a rock-solid balance sheet, then check out our list of net cash growth stocks without delay.
New: AI Stock Screener & Alerts
Our new AI Stock Screener scans the market every day to uncover opportunities.
• Dividend Powerhouses (3%+ Yield)
• Undervalued Small Caps with Insider Buying
• High growth Tech and AI Companies
Or build your own from over 50 metrics.
Have feedback on this article? Concerned about the content? Get in touch with us directly. Alternatively, email editorial-team (at) simplywallst.com.
This article by Simply Wall St is general in nature. We provide commentary based on historical data and analyst forecasts only using an unbiased methodology and our articles are not intended to be financial advice. It does not constitute a recommendation to buy or sell any stock, and does not take account of your objectives, or your financial situation. We aim to bring you long-term focused analysis driven by fundamental data. Note that our analysis may not factor in the latest price-sensitive company announcements or qualitative material. Simply Wall St has no position in any stocks mentioned.
About TSE:4921
Fancl
Engages in the research and development, manufacture, and sale of cosmetics and health food products in Japan, China, North America, Europe, the Middle East, Asia, and Oceania.
Flawless balance sheet with proven track record.
Market Insights


Advertisement
Community Narratives
Nike's Direct-to-Consumer Focus Will Drive Future Growth
Fair Value US$87.90|22.7% undervalued
UN
Community Contributor
Novo Nordisk will dominate GLP-1 market with Ozempic and Wegovy growth
Fair Value US$89.59|14.2% undervalued
BE
Community Contributor
Rheinmetall could get 20-25% of EU-NATO 3%-GDP defence spending
Fair Value €7.57k|82.8% undervalued
NO
Community Contributor