
Advertisement
Key Insights
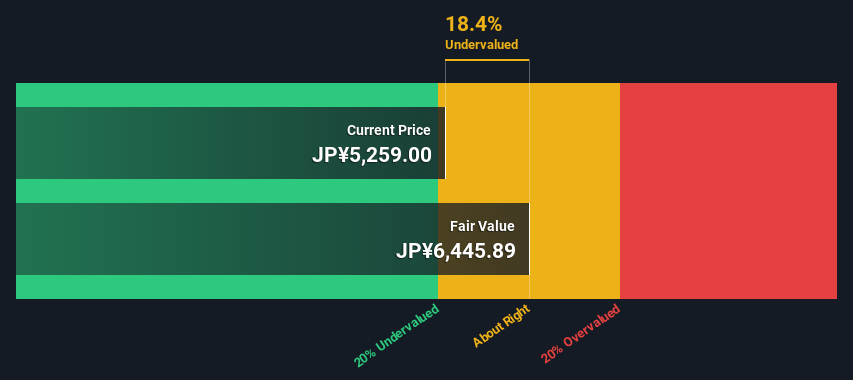
- Using the 2 Stage Free Cash Flow to Equity, Suzuken fair value estimate is JP¥6,446
- With JP¥5,259 share price, Suzuken appears to be trading close to its estimated fair value
- The JP¥5,094 analyst price target for 9987 is 21% less than our estimate of fair value
Today we will run through one way of estimating the intrinsic value of Suzuken Co., Ltd. (TSE:9987) by estimating the company's future cash flows and discounting them to their present value. We will take advantage of the Discounted Cash Flow (DCF) model for this purpose. Models like these may appear beyond the comprehension of a lay person, but they're fairly easy to follow.
Companies can be valued in a lot of ways, so we would point out that a DCF is not perfect for every situation. If you still have some burning questions about this type of valuation, take a look at the Simply Wall St analysis model.
See our latest analysis for Suzuken
Is Suzuken Fairly Valued?
We are going to use a two-stage DCF model, which, as the name states, takes into account two stages of growth. The first stage is generally a higher growth period which levels off heading towards the terminal value, captured in the second 'steady growth' period. To begin with, we have to get estimates of the next ten years of cash flows. Where possible we use analyst estimates, but when these aren't available we extrapolate the previous free cash flow (FCF) from the last estimate or reported value. We assume companies with shrinking free cash flow will slow their rate of shrinkage, and that companies with growing free cash flow will see their growth rate slow, over this period. We do this to reflect that growth tends to slow more in the early years than it does in later years.
Generally we assume that a dollar today is more valuable than a dollar in the future, and so the sum of these future cash flows is then discounted to today's value:
10-year free cash flow (FCF) forecast
| 2025 | 2026 | 2027 | 2028 | 2029 | 2030 | 2031 | 2032 | 2033 | 2034 | |
| Levered FCF (¥, Millions) | -JP¥18.0b | JP¥20.1b | JP¥24.1b | JP¥30.1b | JP¥26.5b | JP¥24.3b | JP¥22.9b | JP¥22.1b | JP¥21.5b | JP¥21.1b |
| Growth Rate Estimate Source | Analyst x1 | Analyst x4 | Analyst x4 | Analyst x2 | Analyst x1 | Est @ -8.19% | Est @ -5.65% | Est @ -3.88% | Est @ -2.64% | Est @ -1.77% |
| Present Value (¥, Millions) Discounted @ 4.2% | -JP¥17.3k | JP¥18.5k | JP¥21.3k | JP¥25.5k | JP¥21.5k | JP¥19.0k | JP¥17.2k | JP¥15.8k | JP¥14.8k | JP¥13.9k |
("Est" = FCF growth rate estimated by Simply Wall St)
Present Value of 10-year Cash Flow (PVCF) = JP¥150b
The second stage is also known as Terminal Value, this is the business's cash flow after the first stage. For a number of reasons a very conservative growth rate is used that cannot exceed that of a country's GDP growth. In this case we have used the 5-year average of the 10-year government bond yield (0.3%) to estimate future growth. In the same way as with the 10-year 'growth' period, we discount future cash flows to today's value, using a cost of equity of 4.2%.
Terminal Value (TV)= FCF2034 × (1 + g) ÷ (r – g) = JP¥21b× (1 + 0.3%) ÷ (4.2%– 0.3%) = JP¥531b
Present Value of Terminal Value (PVTV)= TV / (1 + r)10= JP¥531b÷ ( 1 + 4.2%)10= JP¥350b
The total value, or equity value, is then the sum of the present value of the future cash flows, which in this case is JP¥500b. In the final step we divide the equity value by the number of shares outstanding. Compared to the current share price of JP¥5.3k, the company appears about fair value at a 18% discount to where the stock price trades currently. Remember though, that this is just an approximate valuation, and like any complex formula - garbage in, garbage out.
The Assumptions
The calculation above is very dependent on two assumptions. The first is the discount rate and the other is the cash flows. You don't have to agree with these inputs, I recommend redoing the calculations yourself and playing with them. The DCF also does not consider the possible cyclicality of an industry, or a company's future capital requirements, so it does not give a full picture of a company's potential performance. Given that we are looking at Suzuken as potential shareholders, the cost of equity is used as the discount rate, rather than the cost of capital (or weighted average cost of capital, WACC) which accounts for debt. In this calculation we've used 4.2%, which is based on a levered beta of 0.800. Beta is a measure of a stock's volatility, compared to the market as a whole. We get our beta from the industry average beta of globally comparable companies, with an imposed limit between 0.8 and 2.0, which is a reasonable range for a stable business.
SWOT Analysis for Suzuken
Strength
- Earnings growth over the past year exceeded the industry.
- Currently debt free.
- Dividends are covered by earnings and cash flows.
Weakness
- Dividend is low compared to the top 25% of dividend payers in the Healthcare market.
Opportunity
- Good value based on P/E ratio and estimated fair value.
Threat
- Annual earnings are forecast to decline for the next 3 years.
Moving On:
Valuation is only one side of the coin in terms of building your investment thesis, and it is only one of many factors that you need to assess for a company. It's not possible to obtain a foolproof valuation with a DCF model. Preferably you'd apply different cases and assumptions and see how they would impact the company's valuation. For example, changes in the company's cost of equity or the risk free rate can significantly impact the valuation. For Suzuken, there are three further elements you should assess:
- Risks: You should be aware of the 1 warning sign for Suzuken we've uncovered before considering an investment in the company.
- Future Earnings: How does 9987's growth rate compare to its peers and the wider market? Dig deeper into the analyst consensus number for the upcoming years by interacting with our free analyst growth expectation chart.
- Other High Quality Alternatives: Do you like a good all-rounder? Explore our interactive list of high quality stocks to get an idea of what else is out there you may be missing!
PS. The Simply Wall St app conducts a discounted cash flow valuation for every stock on the TSE every day. If you want to find the calculation for other stocks just search here.
New: Manage All Your Stock Portfolios in One Place
We've created the ultimate portfolio companion for stock investors, and it's free.
• Connect an unlimited number of Portfolios and see your total in one currency
• Be alerted to new Warning Signs or Risks via email or mobile
• Track the Fair Value of your stocks
Have feedback on this article? Concerned about the content? Get in touch with us directly. Alternatively, email editorial-team (at) simplywallst.com.
This article by Simply Wall St is general in nature. We provide commentary based on historical data and analyst forecasts only using an unbiased methodology and our articles are not intended to be financial advice. It does not constitute a recommendation to buy or sell any stock, and does not take account of your objectives, or your financial situation. We aim to bring you long-term focused analysis driven by fundamental data. Note that our analysis may not factor in the latest price-sensitive company announcements or qualitative material. Simply Wall St has no position in any stocks mentioned.
About TSE:9987
Suzuken
Primarily engages in the distribution of pharmaceuticals in Japan and internationally.
Flawless balance sheet and fair value.
Market Insights

Advertisement
Community Narratives
MINISO's fair value is projected at 26.69 with an anticipated PE ratio shift of 20x
Fair Value US$24.03|11.0% undervalued
BE
Community Contributor
Procter & Gamble: A Dividend Giant Facing Slowing Growth
Fair Value US$119.81|23.3% overvalued
AN
Community Contributor
Eli Lilly's Future Growth Driven by Tirzepatide and Favorable Market Conditions
Fair Value US$1.19k|13.8% undervalued
EA
Community Contributor