- Japan
- /
- Healthtech
- /
- TSE:3902
Revenues Not Telling The Story For Medical Data Vision Co., Ltd. (TSE:3902) After Shares Rise 29%


Those holding Medical Data Vision Co., Ltd. (TSE:3902) shares would be relieved that the share price has rebounded 29% in the last thirty days, but it needs to keep going to repair the recent damage it has caused to investor portfolios. Unfortunately, the gains of the last month did little to right the losses of the last year with the stock still down 27% over that time.
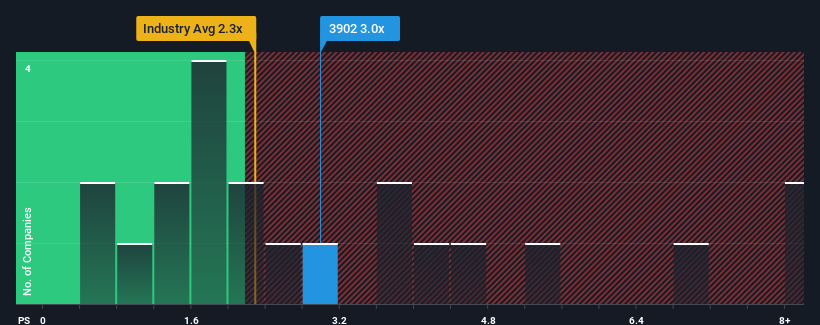
After such a large jump in price, when almost half of the companies in Japan's Healthcare Services industry have price-to-sales ratios (or "P/S") below 2.3x, you may consider Medical Data Vision as a stock probably not worth researching with its 3x P/S ratio. Nonetheless, we'd need to dig a little deeper to determine if there is a rational basis for the elevated P/S.
Check out our latest analysis for Medical Data Vision
How Medical Data Vision Has Been Performing
Medical Data Vision could be doing better as its revenue has been going backwards lately while most other companies have been seeing positive revenue growth. It might be that many expect the dour revenue performance to recover substantially, which has kept the P/S from collapsing. However, if this isn't the case, investors might get caught out paying too much for the stock.
Want the full picture on analyst estimates for the company? Then our free report on Medical Data Vision will help you uncover what's on the horizon.Is There Enough Revenue Growth Forecasted For Medical Data Vision?
There's an inherent assumption that a company should outperform the industry for P/S ratios like Medical Data Vision's to be considered reasonable.
In reviewing the last year of financials, we were disheartened to see the company's revenues fell to the tune of 3.3%. That put a dampener on the good run it was having over the longer-term as its three-year revenue growth is still a noteworthy 13% in total. Accordingly, while they would have preferred to keep the run going, shareholders would be roughly satisfied with the medium-term rates of revenue growth.
Turning to the outlook, the next three years should generate growth of 15% each year as estimated by the three analysts watching the company. That's shaping up to be similar to the 17% per annum growth forecast for the broader industry.
In light of this, it's curious that Medical Data Vision's P/S sits above the majority of other companies. Apparently many investors in the company are more bullish than analysts indicate and aren't willing to let go of their stock right now. Although, additional gains will be difficult to achieve as this level of revenue growth is likely to weigh down the share price eventually.
What We Can Learn From Medical Data Vision's P/S?
The large bounce in Medical Data Vision's shares has lifted the company's P/S handsomely. Generally, our preference is to limit the use of the price-to-sales ratio to establishing what the market thinks about the overall health of a company.
Given Medical Data Vision's future revenue forecasts are in line with the wider industry, the fact that it trades at an elevated P/S is somewhat surprising. Right now we are uncomfortable with the relatively high share price as the predicted future revenues aren't likely to support such positive sentiment for long. A positive change is needed in order to justify the current price-to-sales ratio.
Before you settle on your opinion, we've discovered 3 warning signs for Medical Data Vision that you should be aware of.
Of course, profitable companies with a history of great earnings growth are generally safer bets. So you may wish to see this free collection of other companies that have reasonable P/E ratios and have grown earnings strongly.
If you're looking to trade Medical Data Vision, open an account with the lowest-cost platform trusted by professionals, Interactive Brokers.
With clients in over 200 countries and territories, and access to 160 markets, IBKR lets you trade stocks, options, futures, forex, bonds and funds from a single integrated account.
Enjoy no hidden fees, no account minimums, and FX conversion rates as low as 0.03%, far better than what most brokers offer.
Sponsored ContentNew: Manage All Your Stock Portfolios in One Place
We've created the ultimate portfolio companion for stock investors, and it's free.
• Connect an unlimited number of Portfolios and see your total in one currency
• Be alerted to new Warning Signs or Risks via email or mobile
• Track the Fair Value of your stocks
Have feedback on this article? Concerned about the content? Get in touch with us directly. Alternatively, email editorial-team (at) simplywallst.com.
This article by Simply Wall St is general in nature. We provide commentary based on historical data and analyst forecasts only using an unbiased methodology and our articles are not intended to be financial advice. It does not constitute a recommendation to buy or sell any stock, and does not take account of your objectives, or your financial situation. We aim to bring you long-term focused analysis driven by fundamental data. Note that our analysis may not factor in the latest price-sensitive company announcements or qualitative material. Simply Wall St has no position in any stocks mentioned.
About TSE:3902
Medical Data Vision
Develops, produces, maintains, and sells medical information integration systems in Japan.
Flawless balance sheet with high growth potential.
Market Insights

Community Narratives


