
Advertisement
- Japan
- /
- Healthcare Services
- /
- SPSE:2137
The Returns On Capital At Hikari Heights-VarusLtd (SPSE:2137) Don't Inspire Confidence

What financial metrics can indicate to us that a company is maturing or even in decline? Businesses in decline often have two underlying trends, firstly, a declining return on capital employed (ROCE) and a declining base of capital employed. This indicates to us that the business is not only shrinking the size of its net assets, but its returns are falling as well. On that note, looking into Hikari Heights-VarusLtd (SPSE:2137), we weren't too upbeat about how things were going.
What is Return On Capital Employed (ROCE)?
Just to clarify if you're unsure, ROCE is a metric for evaluating how much pre-tax income (in percentage terms) a company earns on the capital invested in its business. Analysts use this formula to calculate it for Hikari Heights-VarusLtd:
Return on Capital Employed = Earnings Before Interest and Tax (EBIT) ÷ (Total Assets - Current Liabilities)
0.017 = JP¥111m ÷ (JP¥7.6b - JP¥919m) (Based on the trailing twelve months to September 2020).
Therefore, Hikari Heights-VarusLtd has an ROCE of 1.7%. In absolute terms, that's a low return and it also under-performs the Healthcare industry average of 8.3%.
View our latest analysis for Hikari Heights-VarusLtd
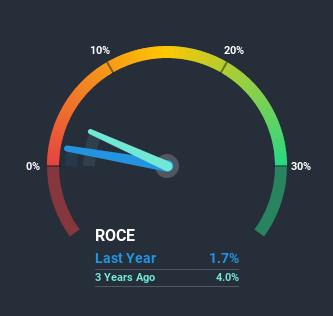
Historical performance is a great place to start when researching a stock so above you can see the gauge for Hikari Heights-VarusLtd's ROCE against it's prior returns. If you're interested in investigating Hikari Heights-VarusLtd's past further, check out this free graph of past earnings, revenue and cash flow.
The Trend Of ROCE
We are a bit worried about the trend of returns on capital at Hikari Heights-VarusLtd. Unfortunately the returns on capital have diminished from the 5.3% that they were earning five years ago. On top of that, it's worth noting that the amount of capital employed within the business has remained relatively steady. Since returns are falling and the business has the same amount of assets employed, this can suggest it's a mature business that hasn't had much growth in the last five years. So because these trends aren't typically conducive to creating a multi-bagger, we wouldn't hold our breath on Hikari Heights-VarusLtd becoming one if things continue as they have.
The Key Takeaway
In the end, the trend of lower returns on the same amount of capital isn't typically an indication that we're looking at a growth stock. Long term shareholders who've owned the stock over the last five years have experienced a 13% depreciation in their investment, so it appears the market might not like these trends either. With underlying trends that aren't great in these areas, we'd consider looking elsewhere.
Hikari Heights-VarusLtd does have some risks, we noticed 3 warning signs (and 1 which is concerning) we think you should know about.
For those who like to invest in solid companies, check out this free list of companies with solid balance sheets and high returns on equity.
When trading Hikari Heights-VarusLtd or any other investment, use the platform considered by many to be the Professional's Gateway to the Worlds Market, Interactive Brokers. You get the lowest-cost* trading on stocks, options, futures, forex, bonds and funds worldwide from a single integrated account. Promoted
Valuation is complex, but we're here to simplify it.
Discover if Hikari Heights-VarusLtd might be undervalued or overvalued with our detailed analysis, featuring fair value estimates, potential risks, dividends, insider trades, and its financial condition.
Access Free AnalysisThis article by Simply Wall St is general in nature. It does not constitute a recommendation to buy or sell any stock, and does not take account of your objectives, or your financial situation. We aim to bring you long-term focused analysis driven by fundamental data. Note that our analysis may not factor in the latest price-sensitive company announcements or qualitative material. Simply Wall St has no position in any stocks mentioned.
*Interactive Brokers Rated Lowest Cost Broker by StockBrokers.com Annual Online Review 2020
Have feedback on this article? Concerned about the content? Get in touch with us directly. Alternatively, email editorial-team@simplywallst.com.
About SPSE:2137
Mediocre balance sheet and slightly overvalued.
Market Insights

Advertisement
Community Narratives

Apple: A Dying Star with an Overpriced Valuation
Fair Value US$177.34|19.1% overvalued
IN
Community Contributor
Avino a case for USD$20 per share within 5 years (assuming $3,500 gold, $100 silver and $4 copper).
Fair Value CA$26.79|86.0% undervalued
AG
Community Contributor
Riding the Defense Boom RENK Sees Revenue Climb at 15% CAGR by FY 2029
Fair Value €69.87|14.3% undervalued
CH
Community Contributor