Wakou Shokuhin (TSE:2813) sheds 11% this week, as yearly returns fall more in line with earnings growth


Wakou Shokuhin Co., Ltd. (TSE:2813) shareholders might be concerned after seeing the share price drop 11% in the last week. But over three years the performance has been really wonderful. Indeed, the share price is up a whopping 418% in that time. So you might argue that the recent reduction in the share price is unremarkable in light of the longer term performance. The share price action could signify that the business itself is dramatically improved, in that time.
In light of the stock dropping 11% in the past week, we want to investigate the longer term story, and see if fundamentals have been the driver of the company's positive three-year return.
See our latest analysis for Wakou Shokuhin
In his essay The Superinvestors of Graham-and-Doddsville Warren Buffett described how share prices do not always rationally reflect the value of a business. One flawed but reasonable way to assess how sentiment around a company has changed is to compare the earnings per share (EPS) with the share price.
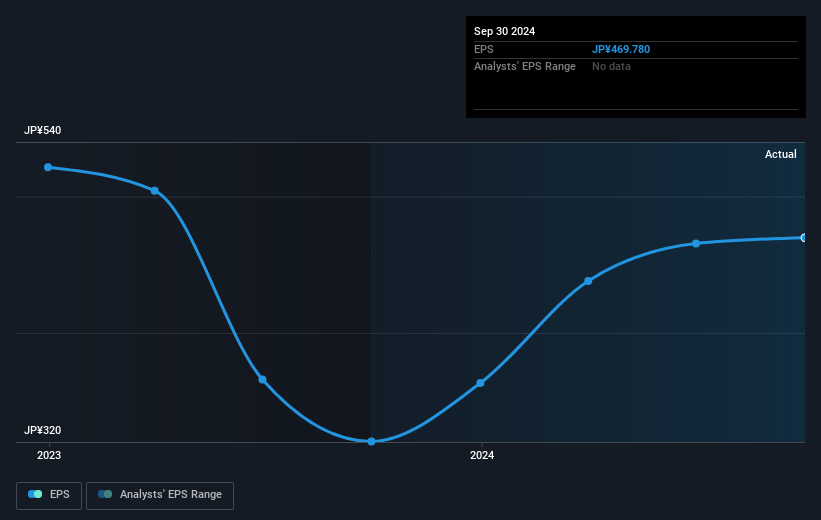
During three years of share price growth, Wakou Shokuhin achieved compound earnings per share growth of 112% per year. This EPS growth is higher than the 73% average annual increase in the share price. So one could reasonably conclude that the market has cooled on the stock. We'd venture the lowish P/E ratio of 10.67 also reflects the negative sentiment around the stock.
You can see how EPS has changed over time in the image below (click on the chart to see the exact values).
Before buying or selling a stock, we always recommend a close examination of historic growth trends, available here.
What About Dividends?
When looking at investment returns, it is important to consider the difference between total shareholder return (TSR) and share price return. Whereas the share price return only reflects the change in the share price, the TSR includes the value of dividends (assuming they were reinvested) and the benefit of any discounted capital raising or spin-off. So for companies that pay a generous dividend, the TSR is often a lot higher than the share price return. We note that for Wakou Shokuhin the TSR over the last 3 years was 440%, which is better than the share price return mentioned above. This is largely a result of its dividend payments!
A Different Perspective
We're pleased to report that Wakou Shokuhin shareholders have received a total shareholder return of 43% over one year. Of course, that includes the dividend. That's better than the annualised return of 34% over half a decade, implying that the company is doing better recently. In the best case scenario, this may hint at some real business momentum, implying that now could be a great time to delve deeper. While it is well worth considering the different impacts that market conditions can have on the share price, there are other factors that are even more important. Consider for instance, the ever-present spectre of investment risk. We've identified 2 warning signs with Wakou Shokuhin , and understanding them should be part of your investment process.
We will like Wakou Shokuhin better if we see some big insider buys. While we wait, check out this free list of undervalued stocks (mostly small caps) with considerable, recent, insider buying.
Please note, the market returns quoted in this article reflect the market weighted average returns of stocks that currently trade on Japanese exchanges.
Valuation is complex, but we're here to simplify it.
Discover if Wakou Shokuhin might be undervalued or overvalued with our detailed analysis, featuring fair value estimates, potential risks, dividends, insider trades, and its financial condition.
Access Free AnalysisHave feedback on this article? Concerned about the content? Get in touch with us directly. Alternatively, email editorial-team (at) simplywallst.com.
This article by Simply Wall St is general in nature. We provide commentary based on historical data and analyst forecasts only using an unbiased methodology and our articles are not intended to be financial advice. It does not constitute a recommendation to buy or sell any stock, and does not take account of your objectives, or your financial situation. We aim to bring you long-term focused analysis driven by fundamental data. Note that our analysis may not factor in the latest price-sensitive company announcements or qualitative material. Simply Wall St has no position in any stocks mentioned.
About TSE:2813
Wakou Shokuhin
Manufactures and sells soups and natural extracts in Japan and internationally.
Flawless balance sheet and good value.
Market Insights

Community Narratives

