

David Iben put it well when he said, 'Volatility is not a risk we care about. What we care about is avoiding the permanent loss of capital.' It's only natural to consider a company's balance sheet when you examine how risky it is, since debt is often involved when a business collapses. We can see that GFA Co., Ltd. (TSE:8783) does use debt in its business. But the more important question is: how much risk is that debt creating?
When Is Debt Dangerous?
Debt assists a business until the business has trouble paying it off, either with new capital or with free cash flow. If things get really bad, the lenders can take control of the business. However, a more common (but still painful) scenario is that it has to raise new equity capital at a low price, thus permanently diluting shareholders. Having said that, the most common situation is where a company manages its debt reasonably well - and to its own advantage. The first step when considering a company's debt levels is to consider its cash and debt together.
See our latest analysis for GFA
How Much Debt Does GFA Carry?
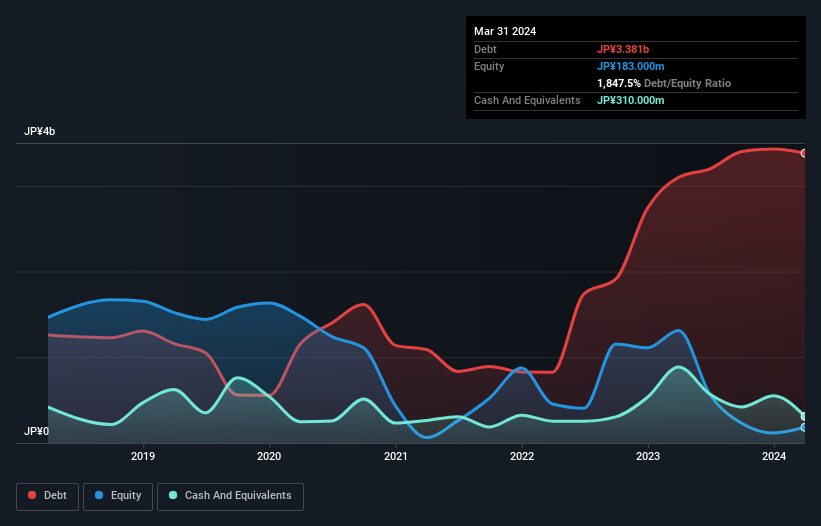
You can click the graphic below for the historical numbers, but it shows that as of March 2024 GFA had JP¥3.38b of debt, an increase on JP¥3.10b, over one year. However, it does have JP¥310.0m in cash offsetting this, leading to net debt of about JP¥3.07b.
How Strong Is GFA's Balance Sheet?
The latest balance sheet data shows that GFA had liabilities of JP¥2.88b due within a year, and liabilities of JP¥1.45b falling due after that. Offsetting this, it had JP¥310.0m in cash and JP¥2.16b in receivables that were due within 12 months. So it has liabilities totalling JP¥1.86b more than its cash and near-term receivables, combined.
While this might seem like a lot, it is not so bad since GFA has a market capitalization of JP¥3.30b, and so it could probably strengthen its balance sheet by raising capital if it needed to. But we definitely want to keep our eyes open to indications that its debt is bringing too much risk. The balance sheet is clearly the area to focus on when you are analysing debt. But you can't view debt in total isolation; since GFA will need earnings to service that debt. So if you're keen to discover more about its earnings, it might be worth checking out this graph of its long term earnings trend.
Over 12 months, GFA reported revenue of JP¥4.2b, which is a gain of 77%, although it did not report any earnings before interest and tax. Shareholders probably have their fingers crossed that it can grow its way to profits.
Caveat Emptor
While we can certainly appreciate GFA's revenue growth, its earnings before interest and tax (EBIT) loss is not ideal. Indeed, it lost a very considerable JP¥2.1b at the EBIT level. Considering that alongside the liabilities mentioned above does not give us much confidence that company should be using so much debt. So we think its balance sheet is a little strained, though not beyond repair. Another cause for caution is that is bled JP¥1.6b in negative free cash flow over the last twelve months. So suffice it to say we consider the stock very risky. There's no doubt that we learn most about debt from the balance sheet. However, not all investment risk resides within the balance sheet - far from it. To that end, you should learn about the 5 warning signs we've spotted with GFA (including 4 which are a bit unpleasant) .
When all is said and done, sometimes its easier to focus on companies that don't even need debt. Readers can access a list of growth stocks with zero net debt 100% free, right now.
New: Manage All Your Stock Portfolios in One Place
We've created the ultimate portfolio companion for stock investors, and it's free.
• Connect an unlimited number of Portfolios and see your total in one currency
• Be alerted to new Warning Signs or Risks via email or mobile
• Track the Fair Value of your stocks
Have feedback on this article? Concerned about the content? Get in touch with us directly. Alternatively, email editorial-team (at) simplywallst.com.
This article by Simply Wall St is general in nature. We provide commentary based on historical data and analyst forecasts only using an unbiased methodology and our articles are not intended to be financial advice. It does not constitute a recommendation to buy or sell any stock, and does not take account of your objectives, or your financial situation. We aim to bring you long-term focused analysis driven by fundamental data. Note that our analysis may not factor in the latest price-sensitive company announcements or qualitative material. Simply Wall St has no position in any stocks mentioned.
Have feedback on this article? Concerned about the content? Get in touch with us directly. Alternatively, email editorial-team@simplywallst.com
About TSE:8783
Moderate with imperfect balance sheet.

