- Japan
- /
- Consumer Services
- /
- TSE:7073
Even With A 36% Surge, Cautious Investors Are Not Rewarding JAIC Co.,Ltd.'s (TSE:7073) Performance Completely


JAIC Co.,Ltd. (TSE:7073) shareholders have had their patience rewarded with a 36% share price jump in the last month. But the gains over the last month weren't enough to make shareholders whole, as the share price is still down 6.5% in the last twelve months.
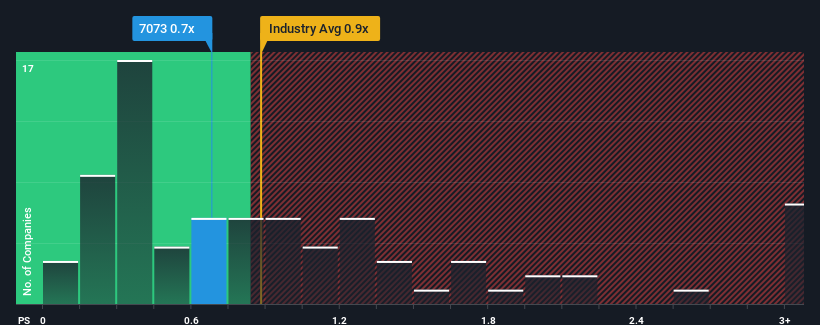
In spite of the firm bounce in price, you could still be forgiven for feeling indifferent about JAICLtd's P/S ratio of 0.7x, since the median price-to-sales (or "P/S") ratio for the Consumer Services industry in Japan is also close to 0.9x. Although, it's not wise to simply ignore the P/S without explanation as investors may be disregarding a distinct opportunity or a costly mistake.
Check out our latest analysis for JAICLtd
How Has JAICLtd Performed Recently?
Revenue has risen firmly for JAICLtd recently, which is pleasing to see. Perhaps the market is expecting future revenue performance to only keep up with the broader industry, which has keeping the P/S in line with expectations. Those who are bullish on JAICLtd will be hoping that this isn't the case, so that they can pick up the stock at a lower valuation.
We don't have analyst forecasts, but you can see how recent trends are setting up the company for the future by checking out our free report on JAICLtd's earnings, revenue and cash flow.Is There Some Revenue Growth Forecasted For JAICLtd?
In order to justify its P/S ratio, JAICLtd would need to produce growth that's similar to the industry.
Taking a look back first, we see that the company managed to grow revenues by a handy 15% last year. The latest three year period has also seen an excellent 64% overall rise in revenue, aided somewhat by its short-term performance. Accordingly, shareholders would have definitely welcomed those medium-term rates of revenue growth.
Comparing that to the industry, which is only predicted to deliver 13% growth in the next 12 months, the company's momentum is stronger based on recent medium-term annualised revenue results.
In light of this, it's curious that JAICLtd's P/S sits in line with the majority of other companies. Apparently some shareholders believe the recent performance is at its limits and have been accepting lower selling prices.
The Bottom Line On JAICLtd's P/S
JAICLtd appears to be back in favour with a solid price jump bringing its P/S back in line with other companies in the industry Using the price-to-sales ratio alone to determine if you should sell your stock isn't sensible, however it can be a practical guide to the company's future prospects.
To our surprise, JAICLtd revealed its three-year revenue trends aren't contributing to its P/S as much as we would have predicted, given they look better than current industry expectations. There could be some unobserved threats to revenue preventing the P/S ratio from matching this positive performance. It appears some are indeed anticipating revenue instability, because the persistence of these recent medium-term conditions would normally provide a boost to the share price.
It is also worth noting that we have found 3 warning signs for JAICLtd (1 shouldn't be ignored!) that you need to take into consideration.
Of course, profitable companies with a history of great earnings growth are generally safer bets. So you may wish to see this free collection of other companies that have reasonable P/E ratios and have grown earnings strongly.
New: Manage All Your Stock Portfolios in One Place
We've created the ultimate portfolio companion for stock investors, and it's free.
• Connect an unlimited number of Portfolios and see your total in one currency
• Be alerted to new Warning Signs or Risks via email or mobile
• Track the Fair Value of your stocks
Have feedback on this article? Concerned about the content? Get in touch with us directly. Alternatively, email editorial-team (at) simplywallst.com.
This article by Simply Wall St is general in nature. We provide commentary based on historical data and analyst forecasts only using an unbiased methodology and our articles are not intended to be financial advice. It does not constitute a recommendation to buy or sell any stock, and does not take account of your objectives, or your financial situation. We aim to bring you long-term focused analysis driven by fundamental data. Note that our analysis may not factor in the latest price-sensitive company announcements or qualitative material. Simply Wall St has no position in any stocks mentioned.
About TSE:7073
Solid track record with excellent balance sheet.
Market Insights

Community Narratives


