
Advertisement
- Japan
- /
- Food and Staples Retail
- /
- TSE:9823
Is Mammy Mart Corporation's (TSE:9823) Stock's Recent Performance Being Led By Its Attractive Financial Prospects?

Most readers would already be aware that Mammy Mart's (TSE:9823) stock increased significantly by 24% over the past three months. Given the company's impressive performance, we decided to study its financial indicators more closely as a company's financial health over the long-term usually dictates market outcomes. Particularly, we will be paying attention to Mammy Mart's ROE today.
ROE or return on equity is a useful tool to assess how effectively a company can generate returns on the investment it received from its shareholders. In other words, it is a profitability ratio which measures the rate of return on the capital provided by the company's shareholders.
View our latest analysis for Mammy Mart
How To Calculate Return On Equity?
The formula for return on equity is:
Return on Equity = Net Profit (from continuing operations) ÷ Shareholders' Equity
So, based on the above formula, the ROE for Mammy Mart is:
12% = JP¥4.7b ÷ JP¥39b (Based on the trailing twelve months to December 2024).
The 'return' is the income the business earned over the last year. So, this means that for every ¥1 of its shareholder's investments, the company generates a profit of ¥0.12.
What Is The Relationship Between ROE And Earnings Growth?
Thus far, we have learned that ROE measures how efficiently a company is generating its profits. We now need to evaluate how much profit the company reinvests or "retains" for future growth which then gives us an idea about the growth potential of the company. Generally speaking, other things being equal, firms with a high return on equity and profit retention, have a higher growth rate than firms that don’t share these attributes.
Mammy Mart's Earnings Growth And 12% ROE
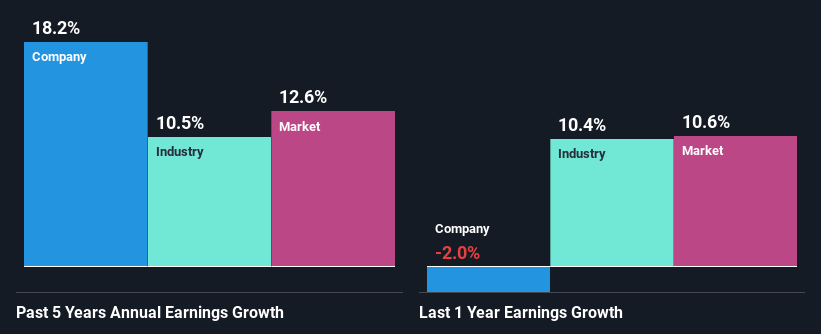
At first glance, Mammy Mart seems to have a decent ROE. On comparing with the average industry ROE of 9.3% the company's ROE looks pretty remarkable. This probably laid the ground for Mammy Mart's moderate 18% net income growth seen over the past five years.
Next, on comparing with the industry net income growth, we found that Mammy Mart's growth is quite high when compared to the industry average growth of 10% in the same period, which is great to see.
Earnings growth is an important metric to consider when valuing a stock. The investor should try to establish if the expected growth or decline in earnings, whichever the case may be, is priced in. Doing so will help them establish if the stock's future looks promising or ominous. One good indicator of expected earnings growth is the P/E ratio which determines the price the market is willing to pay for a stock based on its earnings prospects. So, you may want to check if Mammy Mart is trading on a high P/E or a low P/E, relative to its industry.
Is Mammy Mart Making Efficient Use Of Its Profits?
In Mammy Mart's case, its respectable earnings growth can probably be explained by its low three-year median payout ratio of 20% (or a retention ratio of 80%), which suggests that the company is investing most of its profits to grow its business.
Additionally, Mammy Mart has paid dividends over a period of at least ten years which means that the company is pretty serious about sharing its profits with shareholders.
Summary
In total, we are pretty happy with Mammy Mart's performance. Particularly, we like that the company is reinvesting heavily into its business, and at a high rate of return. Unsurprisingly, this has led to an impressive earnings growth. If the company continues to grow its earnings the way it has, that could have a positive impact on its share price given how earnings per share influence long-term share prices. Not to forget, share price outcomes are also dependent on the potential risks a company may face. So it is important for investors to be aware of the risks involved in the business. To know the 1 risk we have identified for Mammy Mart visit our risks dashboard for free.
New: Manage All Your Stock Portfolios in One Place
We've created the ultimate portfolio companion for stock investors, and it's free.
• Connect an unlimited number of Portfolios and see your total in one currency
• Be alerted to new Warning Signs or Risks via email or mobile
• Track the Fair Value of your stocks
Have feedback on this article? Concerned about the content? Get in touch with us directly. Alternatively, email editorial-team (at) simplywallst.com.
This article by Simply Wall St is general in nature. We provide commentary based on historical data and analyst forecasts only using an unbiased methodology and our articles are not intended to be financial advice. It does not constitute a recommendation to buy or sell any stock, and does not take account of your objectives, or your financial situation. We aim to bring you long-term focused analysis driven by fundamental data. Note that our analysis may not factor in the latest price-sensitive company announcements or qualitative material. Simply Wall St has no position in any stocks mentioned.
About TSE:9823
Excellent balance sheet average dividend payer.
Market Insights

Advertisement
Community Narratives
Enterprise, AI & Cloud Growth Ahead, Waiting For the Right Price 💸
Fair Value US$204.74|10.6% overvalued
FR
Community Contributor
Good foundation, but now it's all about the next steps
Fair Value US$147.87|26.4% undervalued
TO
Community Contributor
XTB's Path to 100–120 PLN by 2028 Amid Market Volatility
Fair Value zł100.96|35.4% undervalued
DZ
Community Contributor