- Japan
- /
- Food and Staples Retail
- /
- TSE:4350
Investors Give Medical System Network Co., Ltd. (TSE:4350) Shares A 28% Hiding

Unfortunately for some shareholders, the Medical System Network Co., Ltd. (TSE:4350) share price has dived 28% in the last thirty days, prolonging recent pain. Looking back over the past twelve months the stock has been a solid performer regardless, with a gain of 10%.
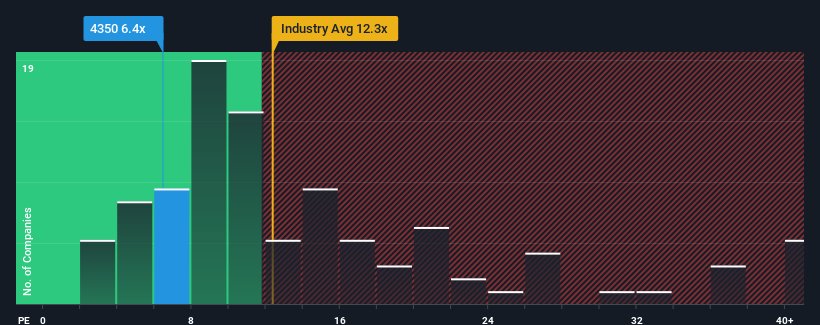
Although its price has dipped substantially, Medical System Network's price-to-earnings (or "P/E") ratio of 6.4x might still make it look like a strong buy right now compared to the market in Japan, where around half of the companies have P/E ratios above 14x and even P/E's above 21x are quite common. Although, it's not wise to just take the P/E at face value as there may be an explanation why it's so limited.
With earnings growth that's superior to most other companies of late, Medical System Network has been doing relatively well. One possibility is that the P/E is low because investors think this strong earnings performance might be less impressive moving forward. If you like the company, you'd be hoping this isn't the case so that you could potentially pick up some stock while it's out of favour.
See our latest analysis for Medical System Network

What Are Growth Metrics Telling Us About The Low P/E?
Medical System Network's P/E ratio would be typical for a company that's expected to deliver very poor growth or even falling earnings, and importantly, perform much worse than the market.
Retrospectively, the last year delivered an exceptional 16% gain to the company's bottom line. However, this wasn't enough as the latest three year period has seen a very unpleasant 12% drop in EPS in aggregate. Accordingly, shareholders would have felt downbeat about the medium-term rates of earnings growth.
Shifting to the future, estimates from the lone analyst covering the company suggest earnings should grow by 17% each year over the next three years. Meanwhile, the rest of the market is forecast to only expand by 9.6% each year, which is noticeably less attractive.
With this information, we find it odd that Medical System Network is trading at a P/E lower than the market. Apparently some shareholders are doubtful of the forecasts and have been accepting significantly lower selling prices.
What We Can Learn From Medical System Network's P/E?
Medical System Network's P/E looks about as weak as its stock price lately. We'd say the price-to-earnings ratio's power isn't primarily as a valuation instrument but rather to gauge current investor sentiment and future expectations.
We've established that Medical System Network currently trades on a much lower than expected P/E since its forecast growth is higher than the wider market. When we see a strong earnings outlook with faster-than-market growth, we assume potential risks are what might be placing significant pressure on the P/E ratio. At least price risks look to be very low, but investors seem to think future earnings could see a lot of volatility.
It's always necessary to consider the ever-present spectre of investment risk. We've identified 4 warning signs with Medical System Network, and understanding these should be part of your investment process.
You might be able to find a better investment than Medical System Network. If you want a selection of possible candidates, check out this free list of interesting companies that trade on a low P/E (but have proven they can grow earnings).
New: Manage All Your Stock Portfolios in One Place
We've created the ultimate portfolio companion for stock investors, and it's free.
• Connect an unlimited number of Portfolios and see your total in one currency
• Be alerted to new Warning Signs or Risks via email or mobile
• Track the Fair Value of your stocks
Have feedback on this article? Concerned about the content? Get in touch with us directly. Alternatively, email editorial-team (at) simplywallst.com.
This article by Simply Wall St is general in nature. We provide commentary based on historical data and analyst forecasts only using an unbiased methodology and our articles are not intended to be financial advice. It does not constitute a recommendation to buy or sell any stock, and does not take account of your objectives, or your financial situation. We aim to bring you long-term focused analysis driven by fundamental data. Note that our analysis may not factor in the latest price-sensitive company announcements or qualitative material. Simply Wall St has no position in any stocks mentioned.
Have feedback on this article? Concerned about the content? Get in touch with us directly. Alternatively, email editorial-team@simplywallst.com
About TSE:4350
Good value average dividend payer.
Similar Companies
Market Insights
Community Narratives


