
Advertisement
Statutory Profit Doesn't Reflect How Good SK JapanLtd's (TSE:7608) Earnings Are

SK Japan Co.,Ltd. (TSE:7608) recently posted some strong earnings, and the market responded positively. We have done some analysis, and we found several positive factors beyond the profit numbers.
See our latest analysis for SK JapanLtd
Zooming In On SK JapanLtd's Earnings
One key financial ratio used to measure how well a company converts its profit to free cash flow (FCF) is the accrual ratio. In plain english, this ratio subtracts FCF from net profit, and divides that number by the company's average operating assets over that period. You could think of the accrual ratio from cashflow as the 'non-FCF profit ratio'.
That means a negative accrual ratio is a good thing, because it shows that the company is bringing in more free cash flow than its profit would suggest. While it's not a problem to have a positive accrual ratio, indicating a certain level of non-cash profits, a high accrual ratio is arguably a bad thing, because it indicates paper profits are not matched by cash flow. Notably, there is some academic evidence that suggests that a high accrual ratio is a bad sign for near-term profits, generally speaking.
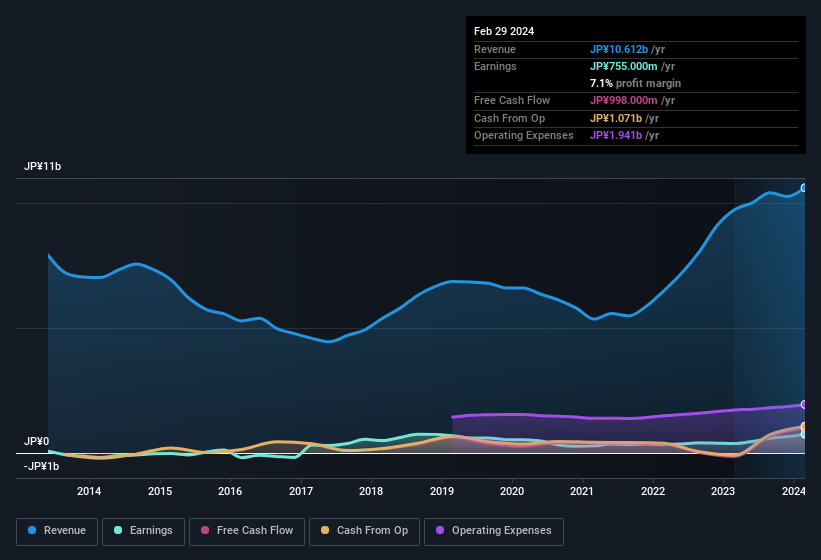
For the year to February 2024, SK JapanLtd had an accrual ratio of -0.17. Therefore, its statutory earnings were very significantly less than its free cashflow. In fact, it had free cash flow of JP¥998m in the last year, which was a lot more than its statutory profit of JP¥755.0m. Notably, SK JapanLtd had negative free cash flow last year, so the JP¥998m it produced this year was a welcome improvement.
Note: we always recommend investors check balance sheet strength. Click here to be taken to our balance sheet analysis of SK JapanLtd.
Our Take On SK JapanLtd's Profit Performance
Happily for shareholders, SK JapanLtd produced plenty of free cash flow to back up its statutory profit numbers. Based on this observation, we consider it possible that SK JapanLtd's statutory profit actually understates its earnings potential! And on top of that, its earnings per share have grown at an extremely impressive rate over the last three years. The goal of this article has been to assess how well we can rely on the statutory earnings to reflect the company's potential, but there is plenty more to consider. In light of this, if you'd like to do more analysis on the company, it's vital to be informed of the risks involved. In terms of investment risks, we've identified 2 warning signs with SK JapanLtd, and understanding them should be part of your investment process.
Today we've zoomed in on a single data point to better understand the nature of SK JapanLtd's profit. But there is always more to discover if you are capable of focussing your mind on minutiae. For example, many people consider a high return on equity as an indication of favorable business economics, while others like to 'follow the money' and search out stocks that insiders are buying. So you may wish to see this free collection of companies boasting high return on equity, or this list of stocks that insiders are buying.
New: Manage All Your Stock Portfolios in One Place
We've created the ultimate portfolio companion for stock investors, and it's free.
• Connect an unlimited number of Portfolios and see your total in one currency
• Be alerted to new Warning Signs or Risks via email or mobile
• Track the Fair Value of your stocks
Have feedback on this article? Concerned about the content? Get in touch with us directly. Alternatively, email editorial-team (at) simplywallst.com.
This article by Simply Wall St is general in nature. We provide commentary based on historical data and analyst forecasts only using an unbiased methodology and our articles are not intended to be financial advice. It does not constitute a recommendation to buy or sell any stock, and does not take account of your objectives, or your financial situation. We aim to bring you long-term focused analysis driven by fundamental data. Note that our analysis may not factor in the latest price-sensitive company announcements or qualitative material. Simply Wall St has no position in any stocks mentioned.
About TSE:7608
SK JapanLtd
Plans, manufactures, and sells character stuffed animals, key chains, household goods, mobile phone accessory goods, prize products, etc.
Flawless balance sheet average dividend payer.
Market Insights

Advertisement
Community Narratives

Apple: A Dying Star with an Overpriced Valuation
Fair Value US$177.34|20.1% overvalued
IN
Community Contributor
Avino a case for USD$20 per share within 5 years (assuming $3,500 gold, $100 silver and $4 copper).
Fair Value CA$26.79|87.5% undervalued
AG
Community Contributor
Riding the Defense Boom RENK Sees Revenue Climb at 15% CAGR by FY 2029
Fair Value €69.87|20.5% undervalued
CH
Community Contributor