Advertisement
- Japan
- /
- Consumer Durables
- /
- TSE:6758
Does Sony Stock Still Offer Value After PS5 Hit Ghost of Yotei Tops UK Sales?

Simply Wall St
Reviewed by Bailey Pemberton
Thinking about Sony Group stock? You would not be alone. Whether you are watching the charts tick upward or just wondering if this is finally the moment to add it to your portfolio, Sony has given investors some real excitement lately. In the short term, the stock is up 5.6% in the past week and nearly 10% over the past month. That is not even counting the eye-popping 36.2% year-to-date gain, or an incredible 68.8% jump over just the last year. Zoom out further, and Sony’s growth looks even more impressive, with a 153.4% rise over three years and 207.4% over five.
Recent headlines help explain some of this momentum. Major PlayStation 5 exclusives continue to dominate game sales, with "Ghost of Yotei" recently taking the top spot in U.K. boxed sales. At the same time, Sony is navigating industry shakeups, from potential tariffs targeting electronics to high-profile intellectual property battles with global competitors like Tencent. These developments have clearly played a role in shaping how investors perceive both Sony’s growth potential and risk profile.
But with big moves comes the big question: does Sony Group offer good value right now? By the numbers, the company is undervalued in just 2 out of 6 valuation checks, giving it a value score of 2. Up next, we will dig into how those valuation metrics stack up and what they really mean for would-be investors. And stick around, because there is an even sharper way to analyze Sony’s true worth that you will not want to miss.
Sony Group scores just 2/6 on our valuation checks. See what other red flags we found in the full valuation breakdown.
Approach 1: Sony Group Discounted Cash Flow (DCF) Analysis
The Discounted Cash Flow (DCF) model is one of the most widely used valuation methods on Wall Street, as it estimates a company’s value by projecting future cash flows and then discounting them to today’s value. In Sony Group’s case, the DCF approach uses both analyst estimates for the first five years and extrapolated data for the later years to model what the company’s future might look like.
Currently, Sony's free cash flow stands at approximately ¥1.86 trillion, or about ¥1.9 trillion to round to the nearest hundred billion. Analyst forecasts predict Sony’s annual free cash flow will remain just above the ¥1 trillion mark over the next five years, with a long-term projection for 2030 landing at roughly ¥1.16 trillion. Estimates beyond that are generated by Simply Wall St’s proprietary model, given the lack of analyst coverage in the later years.
Based on these projections and discounting mechanisms, the DCF valuation yields an estimated intrinsic value of ¥3,066.41 per share. However, this suggests the stock is currently 46.7% overvalued compared to where it should be on fundamentals.
Result: OVERVALUED
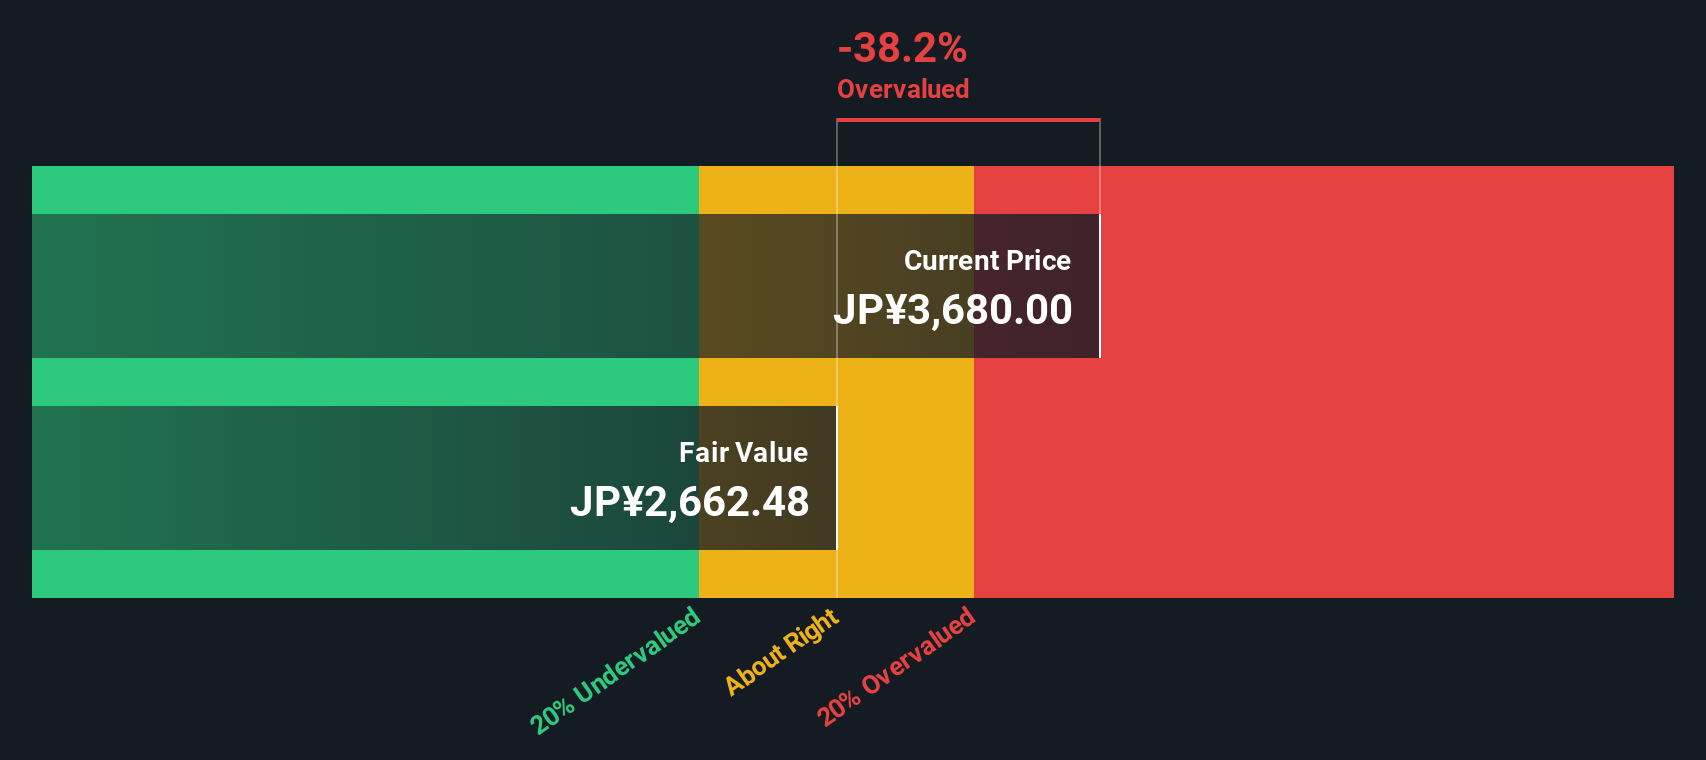
Our Discounted Cash Flow (DCF) analysis suggests Sony Group may be overvalued by 46.7%. Find undervalued stocks or create your own screener to find better value opportunities.
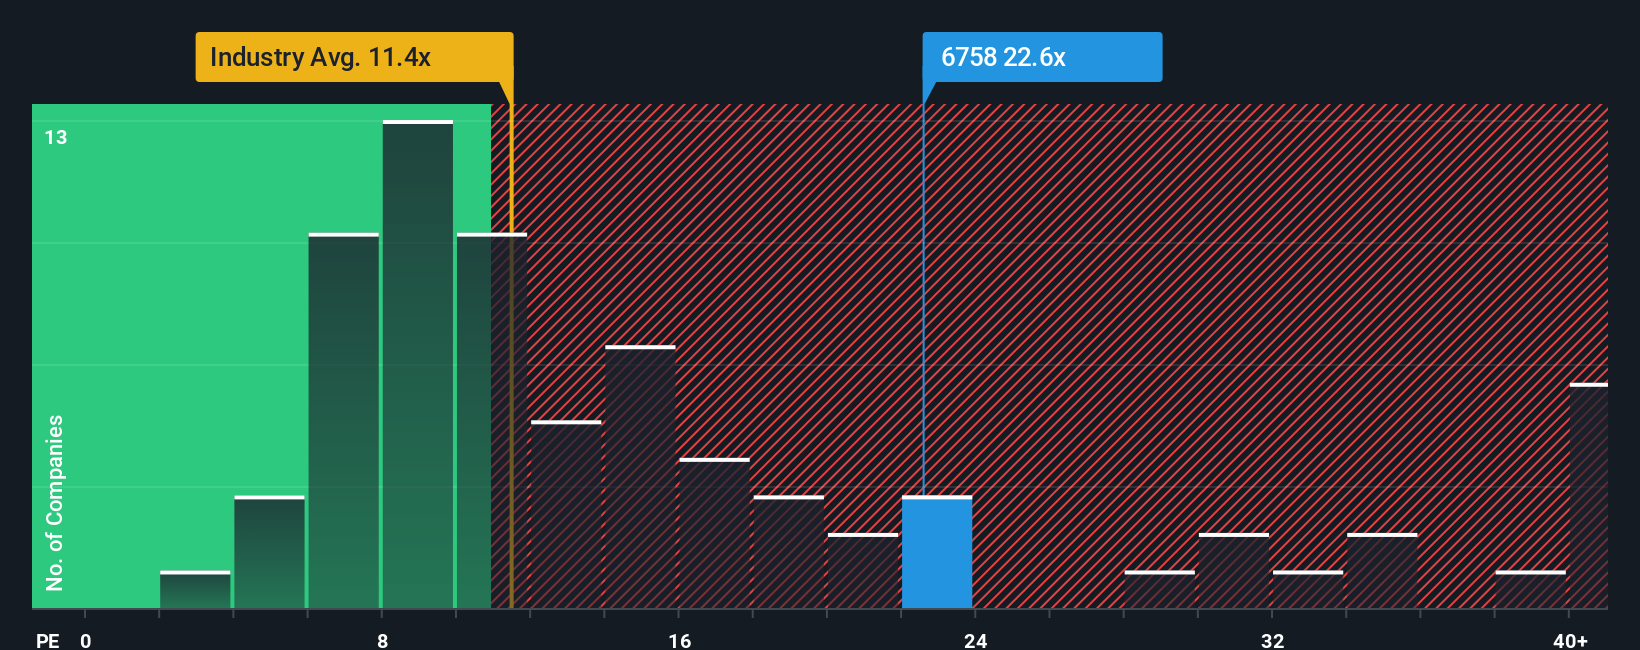
Approach 2: Sony Group Price vs Earnings
The Price-to-Earnings (PE) ratio is a classic tool for valuing profitable companies like Sony Group because it directly relates a company’s stock price to its earnings performance. This metric is especially useful for investors since it sets expectations by factoring in both the company's ability to generate profits and what the market is willing to pay for each unit of those profits.
It is important to remember that a “normal” or “fair” PE ratio is not set in stone. Higher ratios might be justified by faster anticipated earnings growth, lower business risk, or sustainable competitive advantages. Conversely, lower ratios could reflect headwinds, slowdowns, or unique challenges within the industry.
Currently, Sony is trading at a PE ratio of 22.6x. That is above the Consumer Durables industry average of 11.6x, but below the typical peer average of 29.5x. Simply Wall St’s Fair Ratio for Sony, which factors in earnings growth prospects, profit margin, market cap, and risk, lands at 24.1x. Unlike basic peer or industry comparisons, the Fair Ratio provides a more nuanced benchmark by balancing all these key variables specific to Sony’s situation and the broader market context.
Given Sony’s PE ratio is just a shade below the Fair Ratio, the stock looks fairly priced using this approach. It does not appear alarmingly high or notably discounted versus underlying fundamentals.
Result: ABOUT RIGHT
PE ratios tell one story, but what if the real opportunity lies elsewhere? Discover companies where insiders are betting big on explosive growth.
Upgrade Your Decision Making: Choose your Sony Group Narrative
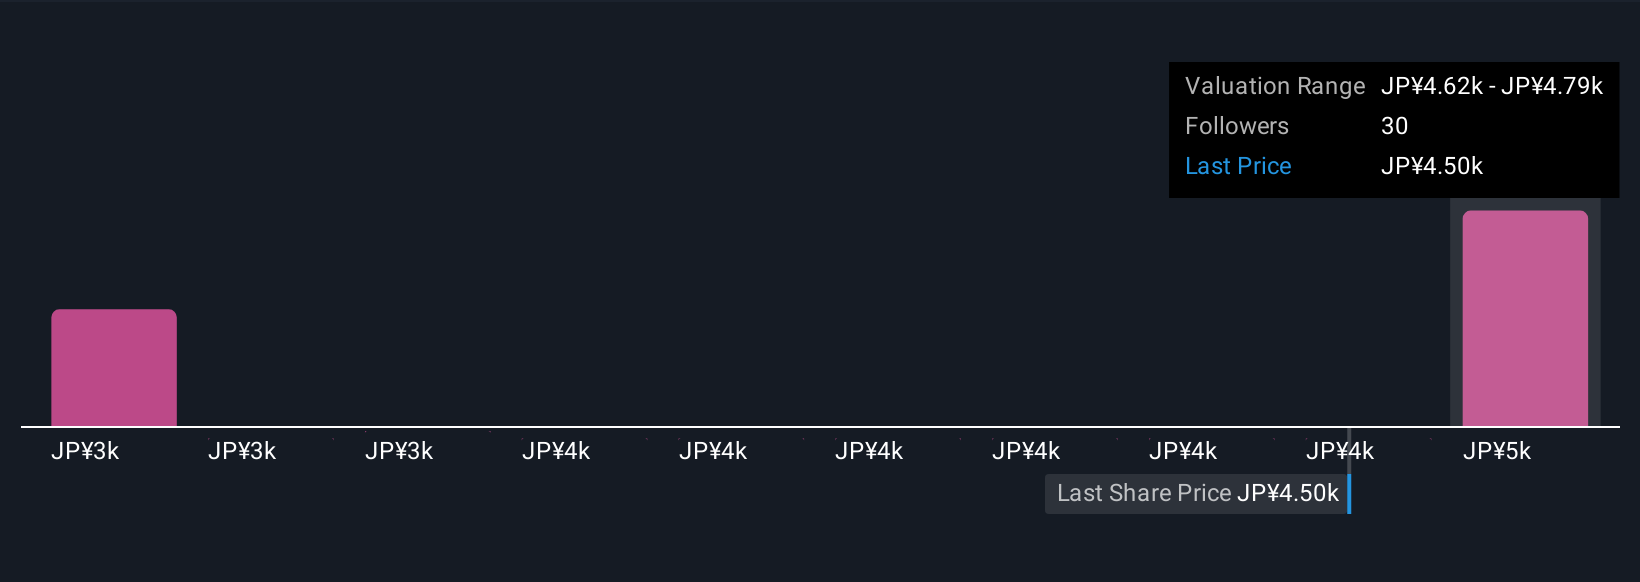
Earlier we mentioned there is an even better way to understand valuation, so let us introduce you to Narratives. A Narrative is a simple, powerful concept on Simply Wall St’s Community page, where you can create and explore investment scenarios linking Sony Group’s unique story, your forecast numbers, and a fair value estimate, all in one place.
A Narrative lets you turn your perspective on Sony, such as its growth in the PlayStation ecosystem, innovation in sensor technology, or challenges in consumer electronics, into a structured thesis that connects real business catalysts to future revenue, earnings, and margins. The result is a transparent fair value number that you can compare directly to today’s market price, making it much easier to decide when to buy or sell.
What sets Narratives apart is their dynamic nature; as news headlines, analyst forecasts, or earnings reports change, your thesis automatically updates, keeping your valuation fresh and relevant without extra effort. For example, one Sony Group Narrative currently forecasts a fair value of ¥4,000 per share due to concerns about tariff risks and slow revenue growth, while another more bullish user sees ¥5,350 per share on the strength of digital entertainment and advanced imaging. This demonstrates how different investment stories lead to different conclusions, all clearly visualized for your decision-making.
Do you think there's more to the story for Sony Group? Create your own Narrative to let the Community know!
This article by Simply Wall St is general in nature. We provide commentary based on historical data and analyst forecasts only using an unbiased methodology and our articles are not intended to be financial advice. It does not constitute a recommendation to buy or sell any stock, and does not take account of your objectives, or your financial situation. We aim to bring you long-term focused analysis driven by fundamental data. Note that our analysis may not factor in the latest price-sensitive company announcements or qualitative material. Simply Wall St has no position in any stocks mentioned.
New: Manage All Your Stock Portfolios in One Place
We've created the ultimate portfolio companion for stock investors, and it's free.
• Connect an unlimited number of Portfolios and see your total in one currency
• Be alerted to new Warning Signs or Risks via email or mobile
• Track the Fair Value of your stocks
Have feedback on this article? Concerned about the content? Get in touch with us directly. Alternatively, email editorial-team@simplywallst.com
About TSE:6758
Sony Group
Designs, develops, produces, and sells electronic equipment, instruments, and devices for the consumer, professional, and industrial markets in Japan, the United States, Europe, China, the Asia-Pacific, and internationally.
Flawless balance sheet with solid track record.
Similar Companies
Market Insights

Advertisement
Community Narratives
MicroVision will explode future revenue by 380.37% with a vision towards success
Fair Value US$60|98.4% undervalued
TH
Community Contributor
The Indispensable Artery for a New North American Economy
Fair Value CA$132.87|0.6% undervalued
TI
Community Contributor
Recently Updated Narratives
MA


MarkoVT on COVER ·
Q3 Outlook modestly optimistic
Fair Value:JP¥1.65k2.0% overvalued
1 followerusers have followed this narrative
0 commentsusers have commented on this narrative
0 likesusers have liked this narrative
BL


BlackGoat on Alphabet ·
Alphabet: The Under-appreciated Compounder Hiding in Plain Sight
Fair Value:US$324.481.3% undervalued
77 followersusers have followed this narrative
3 commentsusers have commented on this narrative
1 likeusers have liked this narrative
BE


Bejgal on MINISO Group Holding ·
MINISO's fair value is projected at 26.69 with an anticipated PE ratio shift of 20x
Fair Value:US$26.6926.7% undervalued
46 followersusers have followed this narrative
3 commentsusers have commented on this narrative
0 likesusers have liked this narrative
Popular Narratives
OS

oscargarcia on Alphabet ·
The company that turned a verb into a global necessity and basically runs the modern internet, digital ads, smartphones, maps, and AI.
Fair Value:US$3405.9% undervalued
136 followersusers have followed this narrative
6 commentsusers have commented on this narrative
18 likesusers have liked this narrative
TH

TheWallstreetKing on MicroVision ·
MicroVision will explode future revenue by 380.37% with a vision towards success
Fair Value:US$6098.4% undervalued
90 followersusers have followed this narrative
10 commentsusers have commented on this narrative
18 likesusers have liked this narrative
AN


AnalystConsensusTarget on NVIDIA ·
NVDA: Expanding AI Demand Will Drive Major Data Center Investments Through 2026
Fair Value:US$232.7922.6% undervalued
928 followersusers have followed this narrative
6 commentsusers have commented on this narrative
22 likesusers have liked this narrative