
Advertisement
Key Insights
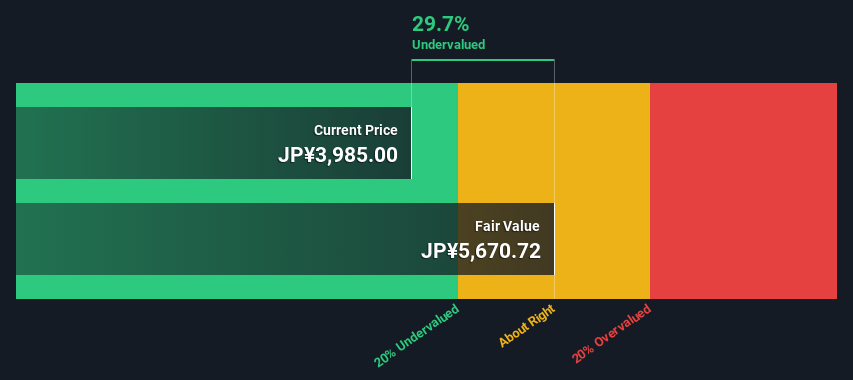
- Using the 2 Stage Free Cash Flow to Equity, DaisekiLtd fair value estimate is JP¥5,671
- DaisekiLtd's JP¥3,985 share price signals that it might be 30% undervalued
- The JP¥4,600 analyst price target for 9793 is 19% less than our estimate of fair value
Today we'll do a simple run through of a valuation method used to estimate the attractiveness of Daiseki Co.,Ltd. (TSE:9793) as an investment opportunity by taking the expected future cash flows and discounting them to their present value. We will take advantage of the Discounted Cash Flow (DCF) model for this purpose. Models like these may appear beyond the comprehension of a lay person, but they're fairly easy to follow.
We generally believe that a company's value is the present value of all of the cash it will generate in the future. However, a DCF is just one valuation metric among many, and it is not without flaws. If you want to learn more about discounted cash flow, the rationale behind this calculation can be read in detail in the Simply Wall St analysis model.
See our latest analysis for DaisekiLtd
Is DaisekiLtd Fairly Valued?
We are going to use a two-stage DCF model, which, as the name states, takes into account two stages of growth. The first stage is generally a higher growth period which levels off heading towards the terminal value, captured in the second 'steady growth' period. In the first stage we need to estimate the cash flows to the business over the next ten years. Where possible we use analyst estimates, but when these aren't available we extrapolate the previous free cash flow (FCF) from the last estimate or reported value. We assume companies with shrinking free cash flow will slow their rate of shrinkage, and that companies with growing free cash flow will see their growth rate slow, over this period. We do this to reflect that growth tends to slow more in the early years than it does in later years.
A DCF is all about the idea that a dollar in the future is less valuable than a dollar today, and so the sum of these future cash flows is then discounted to today's value:
10-year free cash flow (FCF) estimate
| 2025 | 2026 | 2027 | 2028 | 2029 | 2030 | 2031 | 2032 | 2033 | 2034 | |
| Levered FCF (¥, Millions) | JP¥5.39b | JP¥7.73b | JP¥9.01b | JP¥11.9b | JP¥12.6b | JP¥13.0b | JP¥13.3b | JP¥13.5b | JP¥13.7b | JP¥13.8b |
| Growth Rate Estimate Source | Analyst x4 | Analyst x4 | Analyst x3 | Analyst x1 | Analyst x1 | Est @ 3.34% | Est @ 2.41% | Est @ 1.77% | Est @ 1.32% | Est @ 1.00% |
| Present Value (¥, Millions) Discounted @ 4.9% | JP¥5.1k | JP¥7.0k | JP¥7.8k | JP¥9.9k | JP¥9.9k | JP¥9.7k | JP¥9.5k | JP¥9.2k | JP¥8.9k | JP¥8.6k |
("Est" = FCF growth rate estimated by Simply Wall St)
Present Value of 10-year Cash Flow (PVCF) = JP¥86b
We now need to calculate the Terminal Value, which accounts for all the future cash flows after this ten year period. The Gordon Growth formula is used to calculate Terminal Value at a future annual growth rate equal to the 5-year average of the 10-year government bond yield of 0.3%. We discount the terminal cash flows to today's value at a cost of equity of 4.9%.
Terminal Value (TV)= FCF2034 × (1 + g) ÷ (r – g) = JP¥14b× (1 + 0.3%) ÷ (4.9%– 0.3%) = JP¥300b
Present Value of Terminal Value (PVTV)= TV / (1 + r)10= JP¥300b÷ ( 1 + 4.9%)10= JP¥186b
The total value is the sum of cash flows for the next ten years plus the discounted terminal value, which results in the Total Equity Value, which in this case is JP¥272b. To get the intrinsic value per share, we divide this by the total number of shares outstanding. Compared to the current share price of JP¥4.0k, the company appears a touch undervalued at a 30% discount to where the stock price trades currently. Remember though, that this is just an approximate valuation, and like any complex formula - garbage in, garbage out.
The Assumptions
The calculation above is very dependent on two assumptions. The first is the discount rate and the other is the cash flows. If you don't agree with these result, have a go at the calculation yourself and play with the assumptions. The DCF also does not consider the possible cyclicality of an industry, or a company's future capital requirements, so it does not give a full picture of a company's potential performance. Given that we are looking at DaisekiLtd as potential shareholders, the cost of equity is used as the discount rate, rather than the cost of capital (or weighted average cost of capital, WACC) which accounts for debt. In this calculation we've used 4.9%, which is based on a levered beta of 0.928. Beta is a measure of a stock's volatility, compared to the market as a whole. We get our beta from the industry average beta of globally comparable companies, with an imposed limit between 0.8 and 2.0, which is a reasonable range for a stable business.
SWOT Analysis for DaisekiLtd
Strength
- Earnings growth over the past year exceeded the industry.
- Debt is not viewed as a risk.
- Dividends are covered by earnings and cash flows.
Weakness
- Dividend is low compared to the top 25% of dividend payers in the Commercial Services market.
Opportunity
- Annual revenue is forecast to grow faster than the Japanese market.
- Trading below our estimate of fair value by more than 20%.
Threat
- Annual earnings are forecast to grow slower than the Japanese market.
Looking Ahead:
Valuation is only one side of the coin in terms of building your investment thesis, and it ideally won't be the sole piece of analysis you scrutinize for a company. It's not possible to obtain a foolproof valuation with a DCF model. Rather it should be seen as a guide to "what assumptions need to be true for this stock to be under/overvalued?" For instance, if the terminal value growth rate is adjusted slightly, it can dramatically alter the overall result. Why is the intrinsic value higher than the current share price? For DaisekiLtd, we've put together three relevant items you should consider:
- Financial Health: Does 9793 have a healthy balance sheet? Take a look at our free balance sheet analysis with six simple checks on key factors like leverage and risk.
- Future Earnings: How does 9793's growth rate compare to its peers and the wider market? Dig deeper into the analyst consensus number for the upcoming years by interacting with our free analyst growth expectation chart.
- Other Solid Businesses: Low debt, high returns on equity and good past performance are fundamental to a strong business. Why not explore our interactive list of stocks with solid business fundamentals to see if there are other companies you may not have considered!
PS. Simply Wall St updates its DCF calculation for every Japanese stock every day, so if you want to find the intrinsic value of any other stock just search here.
New: Manage All Your Stock Portfolios in One Place
We've created the ultimate portfolio companion for stock investors, and it's free.
• Connect an unlimited number of Portfolios and see your total in one currency
• Be alerted to new Warning Signs or Risks via email or mobile
• Track the Fair Value of your stocks
Have feedback on this article? Concerned about the content? Get in touch with us directly. Alternatively, email editorial-team (at) simplywallst.com.
This article by Simply Wall St is general in nature. We provide commentary based on historical data and analyst forecasts only using an unbiased methodology and our articles are not intended to be financial advice. It does not constitute a recommendation to buy or sell any stock, and does not take account of your objectives, or your financial situation. We aim to bring you long-term focused analysis driven by fundamental data. Note that our analysis may not factor in the latest price-sensitive company announcements or qualitative material. Simply Wall St has no position in any stocks mentioned.
About TSE:9793
DaisekiLtd
Engages industrial waste treatment and resource recycling activities in Japan.
Excellent balance sheet average dividend payer.
Market Insights

Advertisement
Community Narratives
Pinterest will surge as advertising innovations ignite revenue growth
Fair Value US$42.63|26.3% undervalued
BR
Community Contributor
Brambles' Revenue Set to Climb 14% with Profit Margins Following
Fair Value AU$21.90|4.9% overvalued
RO
Community Contributor
Challenging Future for STG as Organic Sales Decline by 8.8%
Fair Value DKK 116.13|26.8% undervalued
KA
Community Contributor