- Japan
- /
- Commercial Services
- /
- TSE:7901
Risks Still Elevated At These Prices As Matsumoto Inc. (TSE:7901) Shares Dive 30%

Matsumoto Inc. (TSE:7901) shareholders won't be pleased to see that the share price has had a very rough month, dropping 30% and undoing the prior period's positive performance. The recent drop completes a disastrous twelve months for shareholders, who are sitting on a 70% loss during that time.
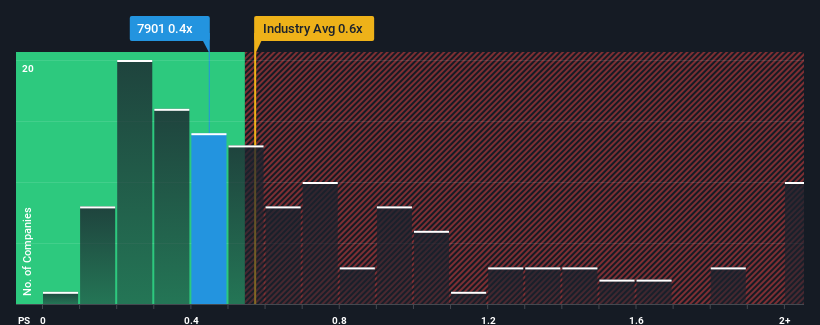
In spite of the heavy fall in price, you could still be forgiven for feeling indifferent about Matsumoto's P/S ratio of 0.4x, since the median price-to-sales (or "P/S") ratio for the Commercial Services industry in Japan is also close to 0.6x. However, investors might be overlooking a clear opportunity or potential setback if there is no rational basis for the P/S.
See our latest analysis for Matsumoto
How Has Matsumoto Performed Recently?
We'd have to say that with no tangible growth over the last year, Matsumoto's revenue has been unimpressive. Perhaps the market believes the recent run-of-the-mill revenue performance isn't enough to outperform the industry, which has kept the P/S muted. Those who are bullish on Matsumoto will be hoping that this isn't the case, so that they can pick up the stock at a lower valuation.
Want the full picture on earnings, revenue and cash flow for the company? Then our free report on Matsumoto will help you shine a light on its historical performance.What Are Revenue Growth Metrics Telling Us About The P/S?
The only time you'd be comfortable seeing a P/S like Matsumoto's is when the company's growth is tracking the industry closely.
Taking a look back first, we see that there was hardly any revenue growth to speak of for the company over the past year. This isn't what shareholders were looking for as it means they've been left with a 8.9% decline in revenue over the last three years in total. Accordingly, shareholders would have felt downbeat about the medium-term rates of revenue growth.
In contrast to the company, the rest of the industry is expected to grow by 4.9% over the next year, which really puts the company's recent medium-term revenue decline into perspective.
In light of this, it's somewhat alarming that Matsumoto's P/S sits in line with the majority of other companies. Apparently many investors in the company are way less bearish than recent times would indicate and aren't willing to let go of their stock right now. Only the boldest would assume these prices are sustainable as a continuation of recent revenue trends is likely to weigh on the share price eventually.
The Key Takeaway
With its share price dropping off a cliff, the P/S for Matsumoto looks to be in line with the rest of the Commercial Services industry. Using the price-to-sales ratio alone to determine if you should sell your stock isn't sensible, however it can be a practical guide to the company's future prospects.
We find it unexpected that Matsumoto trades at a P/S ratio that is comparable to the rest of the industry, despite experiencing declining revenues during the medium-term, while the industry as a whole is expected to grow. When we see revenue heading backwards in the context of growing industry forecasts, it'd make sense to expect a possible share price decline on the horizon, sending the moderate P/S lower. Unless the recent medium-term conditions improve markedly, investors will have a hard time accepting the share price as fair value.
You always need to take note of risks, for example - Matsumoto has 3 warning signs we think you should be aware of.
If companies with solid past earnings growth is up your alley, you may wish to see this free collection of other companies with strong earnings growth and low P/E ratios.
If you're looking to trade Matsumoto, open an account with the lowest-cost platform trusted by professionals, Interactive Brokers.
With clients in over 200 countries and territories, and access to 160 markets, IBKR lets you trade stocks, options, futures, forex, bonds and funds from a single integrated account.
Enjoy no hidden fees, no account minimums, and FX conversion rates as low as 0.03%, far better than what most brokers offer.
Sponsored ContentNew: Manage All Your Stock Portfolios in One Place
We've created the ultimate portfolio companion for stock investors, and it's free.
• Connect an unlimited number of Portfolios and see your total in one currency
• Be alerted to new Warning Signs or Risks via email or mobile
• Track the Fair Value of your stocks
Have feedback on this article? Concerned about the content? Get in touch with us directly. Alternatively, email editorial-team (at) simplywallst.com.
This article by Simply Wall St is general in nature. We provide commentary based on historical data and analyst forecasts only using an unbiased methodology and our articles are not intended to be financial advice. It does not constitute a recommendation to buy or sell any stock, and does not take account of your objectives, or your financial situation. We aim to bring you long-term focused analysis driven by fundamental data. Note that our analysis may not factor in the latest price-sensitive company announcements or qualitative material. Simply Wall St has no position in any stocks mentioned.
About TSE:7901
Low and overvalued.
Market Insights

Community Narratives


