Advertisement
- Japan
- /
- Commercial Services
- /
- TSE:7373
Aidma Holdings (TSE:7373) Earnings Growth Surpasses 5-Year Trend, Reinforcing Bullish Narratives

Simply Wall St
Reviewed by Simply Wall St
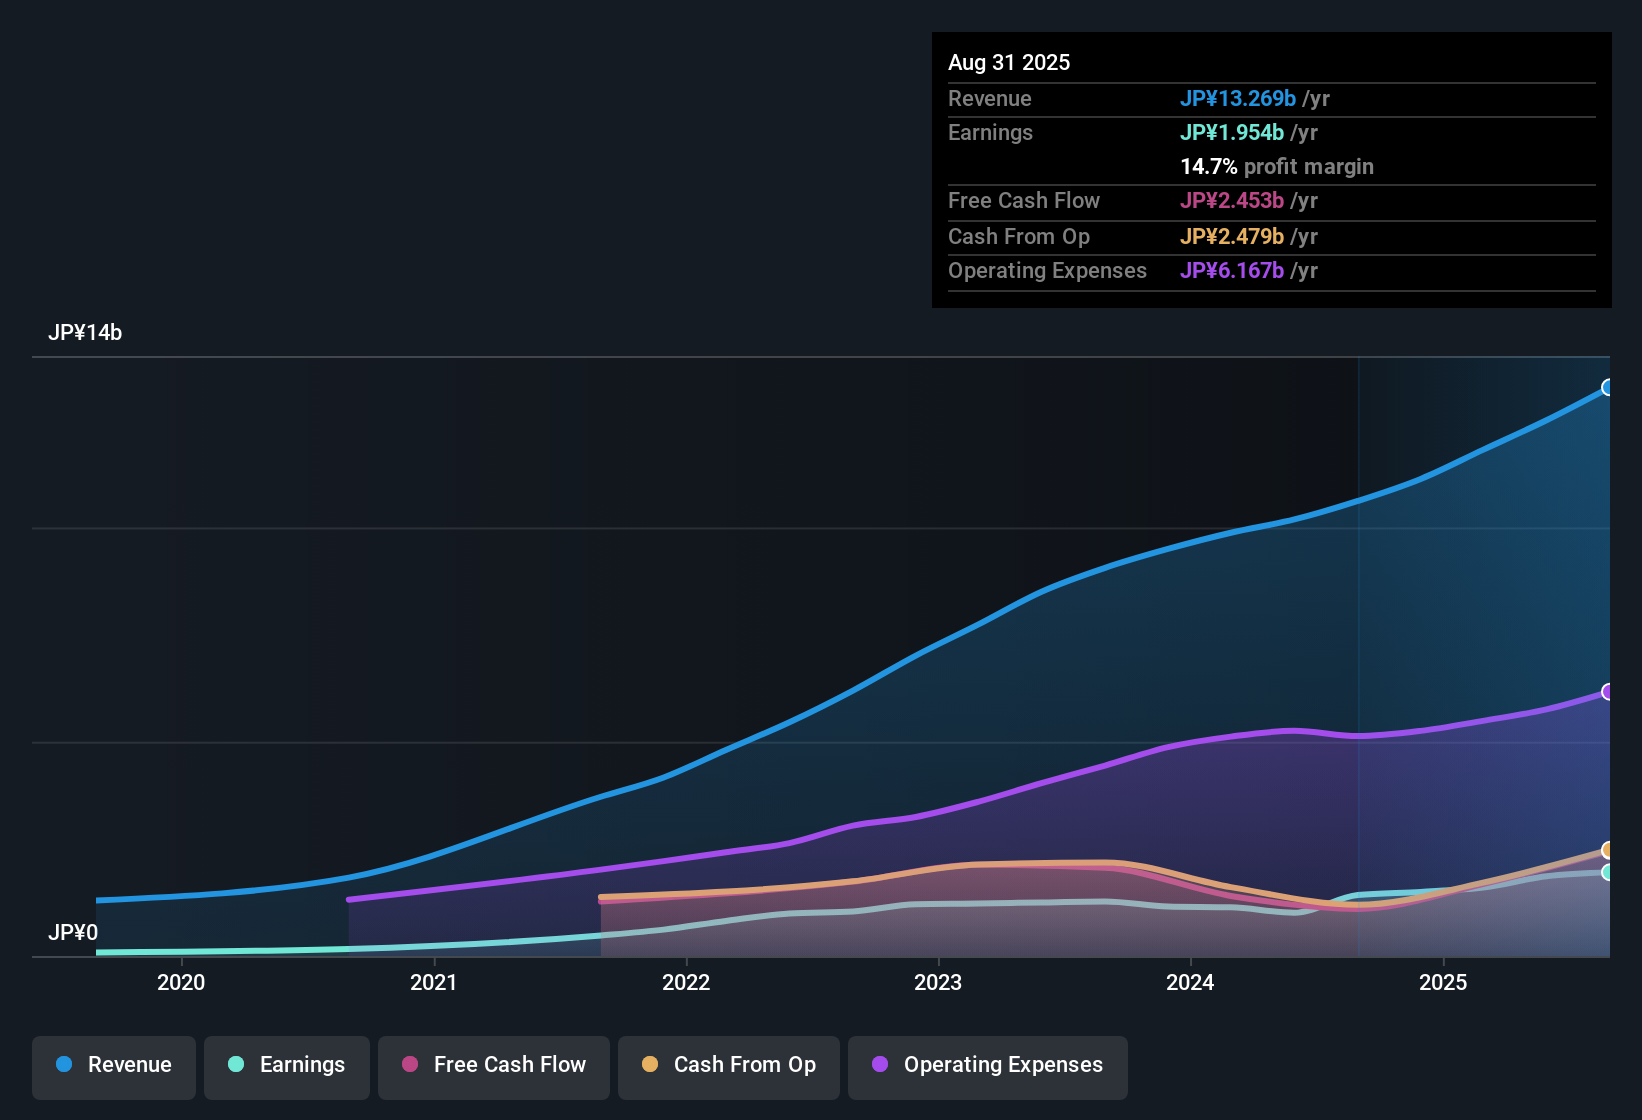
Aidma Holdings (TSE:7373) posted earnings growth of 37.1% over the past year, beating its five-year average growth rate of 25.7% per year. Net profit margins climbed to 14.7%, up from 13.4% a year ago, while earnings are projected to rise 16.6% annually, outpacing the broader Japanese market’s 8.1% growth forecast. With these upbeat results and a share price of ¥2,747 sitting below an estimated fair value of ¥4,193.96, investors will likely see the combination of margin improvement, robust growth, and discounted valuation as strong positives, even as the stock trades at a premium multiple and recent share price stability remains in question.
See our full analysis for Aidma Holdings.Now, let’s see how these headline results compare to the biggest narratives surrounding Aidma Holdings. Here is where the stories might be changing.
Curious how numbers become stories that shape markets? Explore Community Narratives
Margin Strength Tops the Story
- Net profit margins have reached 14.7%, up a full percentage point from 13.4% the previous year. This underlines a clear trend of improving profitability even as revenue expands at a robust pace.
- This strongly supports the bullish case that sustained margin improvement signals quality growth.
- Analysts are watching to see if the margin uplift can withstand competitive pressures, since profit expansion like this typically points to both strong cost control and demand.
- Bulls argue the company is well positioned if future revenues keep compounding at the current rate, as higher margins offer extra protection during weaker market periods.
Growth Outpaces the Broader Market
- With earnings forecast to increase by 16.6% annually and revenue to climb at 20.2% per year, Aidma Holdings offers a rare above-market pace compared to the Japanese average of 8.1% earnings growth and 4.4% revenue growth.
- What is surprising is how these growth forecasts contrast with the prevailing market view:
- While sector trends provide a supportive backdrop, investors are weighing whether Aidma can keep outgrowing its peers as sector headwinds and execution risks come into play.
- Future upside depends not just on maintaining this growth streak but also on delivering efficiently. These forecasts suggest this is possible, though not guaranteed.
DCF Fair Value Still Distinctly Higher
- The current share price of ¥2,747 is well below the discounted cash flow (DCF) fair value estimate of ¥4,193.96. The price-to-earnings ratio of 21.2x stands higher than industry and peer averages, creating tension between value and multiple-based views.
- This unexpectedly wide gap challenges typical valuation thinking:
- Analysts note that a lower market price against a higher DCF value can signal future re-rating potential, depending on whether growth and margin trends persist.
- Still, the premium earnings multiple calls for delivery on these expectations, so investors are closely monitoring if the current discount represents opportunity or simply reflects market caution on execution and stability.
Next Steps
Don't just look at this quarter; the real story is in the long-term trend. We've done an in-depth analysis on Aidma Holdings's growth and its valuation to see if today's price is a bargain. Add the company to your watchlist or portfolio now so you don't miss the next big move.
See What Else Is Out There
Although Aidma Holdings posts strong growth and margin expansion, uncertainty lingers over share price stability and whether premium valuations can be justified over time.
If you'd prefer companies with proven, consistent earnings power and less market volatility, use our stable growth stocks screener to focus on those delivering steady growth through changing conditions.
This article by Simply Wall St is general in nature. We provide commentary based on historical data and analyst forecasts only using an unbiased methodology and our articles are not intended to be financial advice. It does not constitute a recommendation to buy or sell any stock, and does not take account of your objectives, or your financial situation. We aim to bring you long-term focused analysis driven by fundamental data. Note that our analysis may not factor in the latest price-sensitive company announcements or qualitative material. Simply Wall St has no position in any stocks mentioned.
New: Manage All Your Stock Portfolios in One Place
We've created the ultimate portfolio companion for stock investors, and it's free.
• Connect an unlimited number of Portfolios and see your total in one currency
• Be alerted to new Warning Signs or Risks via email or mobile
• Track the Fair Value of your stocks
Have feedback on this article? Concerned about the content? Get in touch with us directly. Alternatively, email editorial-team@simplywallst.com
About TSE:7373
Aidma Holdings
Engages in the sales, business, and management support businesses in Japan and internationally.
Outstanding track record with flawless balance sheet.
Market Insights

Advertisement
Community Narratives
A formidable player in AI and enterprise computing.
Fair Value US$210.00|12.2% overvalued
CO
Community Contributor
IREN's Bold Moves in Sustainable Bitcoin Mining & AI Data Centers
Fair Value US$72.52|17.1% undervalued
BL
Community Contributor
Cooling the Champions: The Aussie Tech Behind F1's Victories
Fair Value AU$12.40|38.7% undervalued
TR
Community Contributor