- Japan
- /
- Professional Services
- /
- TSE:6171
Earnings Tell The Story For C.E.Management Integrated Laboratory Co.Ltd (TSE:6171) As Its Stock Soars 49%


The C.E.Management Integrated Laboratory Co.Ltd (TSE:6171) share price has done very well over the last month, posting an excellent gain of 49%. The last 30 days bring the annual gain to a very sharp 36%.
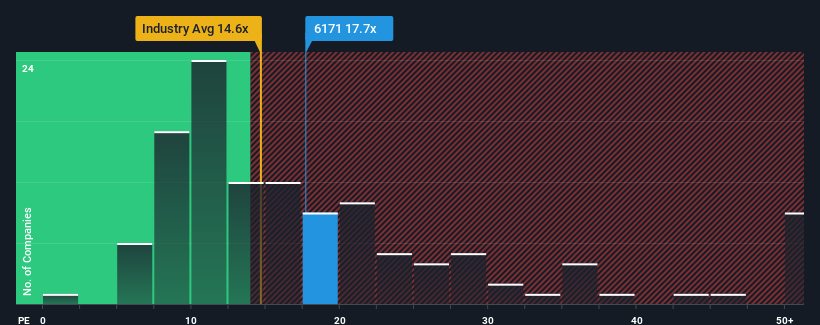
Since its price has surged higher, C.E.Management Integrated LaboratoryLtd's price-to-earnings (or "P/E") ratio of 17.7x might make it look like a sell right now compared to the market in Japan, where around half of the companies have P/E ratios below 13x and even P/E's below 9x are quite common. Nonetheless, we'd need to dig a little deeper to determine if there is a rational basis for the elevated P/E.
C.E.Management Integrated LaboratoryLtd certainly has been doing a great job lately as it's been growing earnings at a really rapid pace. The P/E is probably high because investors think this strong earnings growth will be enough to outperform the broader market in the near future. You'd really hope so, otherwise you're paying a pretty hefty price for no particular reason.
See our latest analysis for C.E.Management Integrated LaboratoryLtd
Is There Enough Growth For C.E.Management Integrated LaboratoryLtd?
There's an inherent assumption that a company should outperform the market for P/E ratios like C.E.Management Integrated LaboratoryLtd's to be considered reasonable.
Retrospectively, the last year delivered an exceptional 90% gain to the company's bottom line. Pleasingly, EPS has also lifted 71% in aggregate from three years ago, thanks to the last 12 months of growth. Accordingly, shareholders would have probably welcomed those medium-term rates of earnings growth.
This is in contrast to the rest of the market, which is expected to grow by 10% over the next year, materially lower than the company's recent medium-term annualised growth rates.
With this information, we can see why C.E.Management Integrated LaboratoryLtd is trading at such a high P/E compared to the market. It seems most investors are expecting this strong growth to continue and are willing to pay more for the stock.
What We Can Learn From C.E.Management Integrated LaboratoryLtd's P/E?
The large bounce in C.E.Management Integrated LaboratoryLtd's shares has lifted the company's P/E to a fairly high level. Using the price-to-earnings ratio alone to determine if you should sell your stock isn't sensible, however it can be a practical guide to the company's future prospects.
We've established that C.E.Management Integrated LaboratoryLtd maintains its high P/E on the strength of its recent three-year growth being higher than the wider market forecast, as expected. At this stage investors feel the potential for a deterioration in earnings isn't great enough to justify a lower P/E ratio. If recent medium-term earnings trends continue, it's hard to see the share price falling strongly in the near future under these circumstances.
Plus, you should also learn about these 3 warning signs we've spotted with C.E.Management Integrated LaboratoryLtd (including 1 which can't be ignored).
If these risks are making you reconsider your opinion on C.E.Management Integrated LaboratoryLtd, explore our interactive list of high quality stocks to get an idea of what else is out there.
New: AI Stock Screener & Alerts
Our new AI Stock Screener scans the market every day to uncover opportunities.
• Dividend Powerhouses (3%+ Yield)
• Undervalued Small Caps with Insider Buying
• High growth Tech and AI Companies
Or build your own from over 50 metrics.
Have feedback on this article? Concerned about the content? Get in touch with us directly. Alternatively, email editorial-team (at) simplywallst.com.
This article by Simply Wall St is general in nature. We provide commentary based on historical data and analyst forecasts only using an unbiased methodology and our articles are not intended to be financial advice. It does not constitute a recommendation to buy or sell any stock, and does not take account of your objectives, or your financial situation. We aim to bring you long-term focused analysis driven by fundamental data. Note that our analysis may not factor in the latest price-sensitive company announcements or qualitative material. Simply Wall St has no position in any stocks mentioned.
About TSE:6171
C.E.Management Integrated LaboratoryLtd
Provides services in the areas of civil engineering and construction in Japan.
Excellent balance sheet with proven track record.
Market Insights

Community Narratives

