

What trends should we look for it we want to identify stocks that can multiply in value over the long term? In a perfect world, we'd like to see a company investing more capital into its business and ideally the returns earned from that capital are also increasing. This shows us that it's a compounding machine, able to continually reinvest its earnings back into the business and generate higher returns. So when we looked at Asaka RikenLtd (TSE:5724) and its trend of ROCE, we really liked what we saw.
Our free stock report includes 3 warning signs investors should be aware of before investing in Asaka RikenLtd. Read for free now.Return On Capital Employed (ROCE): What Is It?
Just to clarify if you're unsure, ROCE is a metric for evaluating how much pre-tax income (in percentage terms) a company earns on the capital invested in its business. The formula for this calculation on Asaka RikenLtd is:
Return on Capital Employed = Earnings Before Interest and Tax (EBIT) ÷ (Total Assets - Current Liabilities)
0.047 = JP¥402m ÷ (JP¥11b - JP¥2.1b) (Based on the trailing twelve months to December 2024).
So, Asaka RikenLtd has an ROCE of 4.7%. Ultimately, that's a low return and it under-performs the Commercial Services industry average of 9.7%.
See our latest analysis for Asaka RikenLtd
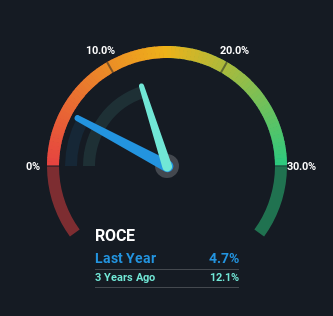
While the past is not representative of the future, it can be helpful to know how a company has performed historically, which is why we have this chart above. If you'd like to look at how Asaka RikenLtd has performed in the past in other metrics, you can view this free graph of Asaka RikenLtd's past earnings, revenue and cash flow.
What Can We Tell From Asaka RikenLtd's ROCE Trend?
Even though ROCE is still low in absolute terms, it's good to see it's heading in the right direction. The data shows that returns on capital have increased substantially over the last five years to 4.7%. The company is effectively making more money per dollar of capital used, and it's worth noting that the amount of capital has increased too, by 107%. So we're very much inspired by what we're seeing at Asaka RikenLtd thanks to its ability to profitably reinvest capital.
One more thing to note, Asaka RikenLtd has decreased current liabilities to 20% of total assets over this period, which effectively reduces the amount of funding from suppliers or short-term creditors. This tells us that Asaka RikenLtd has grown its returns without a reliance on increasing their current liabilities, which we're very happy with.
The Key Takeaway
A company that is growing its returns on capital and can consistently reinvest in itself is a highly sought after trait, and that's what Asaka RikenLtd has. Since the stock has returned a solid 69% to shareholders over the last five years, it's fair to say investors are beginning to recognize these changes. With that being said, we still think the promising fundamentals mean the company deserves some further due diligence.
One final note, you should learn about the 3 warning signs we've spotted with Asaka RikenLtd (including 1 which is concerning) .
If you want to search for solid companies with great earnings, check out this free list of companies with good balance sheets and impressive returns on equity.
New: Manage All Your Stock Portfolios in One Place
We've created the ultimate portfolio companion for stock investors, and it's free.
• Connect an unlimited number of Portfolios and see your total in one currency
• Be alerted to new Warning Signs or Risks via email or mobile
• Track the Fair Value of your stocks
Have feedback on this article? Concerned about the content? Get in touch with us directly. Alternatively, email editorial-team (at) simplywallst.com.
This article by Simply Wall St is general in nature. We provide commentary based on historical data and analyst forecasts only using an unbiased methodology and our articles are not intended to be financial advice. It does not constitute a recommendation to buy or sell any stock, and does not take account of your objectives, or your financial situation. We aim to bring you long-term focused analysis driven by fundamental data. Note that our analysis may not factor in the latest price-sensitive company announcements or qualitative material. Simply Wall St has no position in any stocks mentioned.
About TSE:5724
Asaka RikenLtd
Engages in the precious metal, environmental, and other businesses in Japan.
Flawless balance sheet with proven track record.
Market Insights

Community Narratives


