
Advertisement
- Japan
- /
- Professional Services
- /
- TSE:5070
DRAFT Inc.'s (TSE:5070) Stock Has Seen Strong Momentum: Does That Call For Deeper Study Of Its Financial Prospects?
DRAFT's (TSE:5070) stock is up by a considerable 29% over the past month. Given that stock prices are usually aligned with a company's financial performance in the long-term, we decided to study its financial indicators more closely to see if they had a hand to play in the recent price move. Specifically, we decided to study DRAFT's ROE in this article.
Return on Equity or ROE is a test of how effectively a company is growing its value and managing investors’ money. In other words, it is a profitability ratio which measures the rate of return on the capital provided by the company's shareholders.
How Is ROE Calculated?
The formula for return on equity is:
Return on Equity = Net Profit (from continuing operations) ÷ Shareholders' Equity
So, based on the above formula, the ROE for DRAFT is:
6.4% = JP¥239m ÷ JP¥3.7b (Based on the trailing twelve months to March 2025).
The 'return' is the amount earned after tax over the last twelve months. One way to conceptualize this is that for each ¥1 of shareholders' capital it has, the company made ¥0.06 in profit.
View our latest analysis for DRAFT
What Has ROE Got To Do With Earnings Growth?
So far, we've learned that ROE is a measure of a company's profitability. Depending on how much of these profits the company reinvests or "retains", and how effectively it does so, we are then able to assess a company’s earnings growth potential. Assuming all else is equal, companies that have both a higher return on equity and higher profit retention are usually the ones that have a higher growth rate when compared to companies that don't have the same features.
DRAFT's Earnings Growth And 6.4% ROE
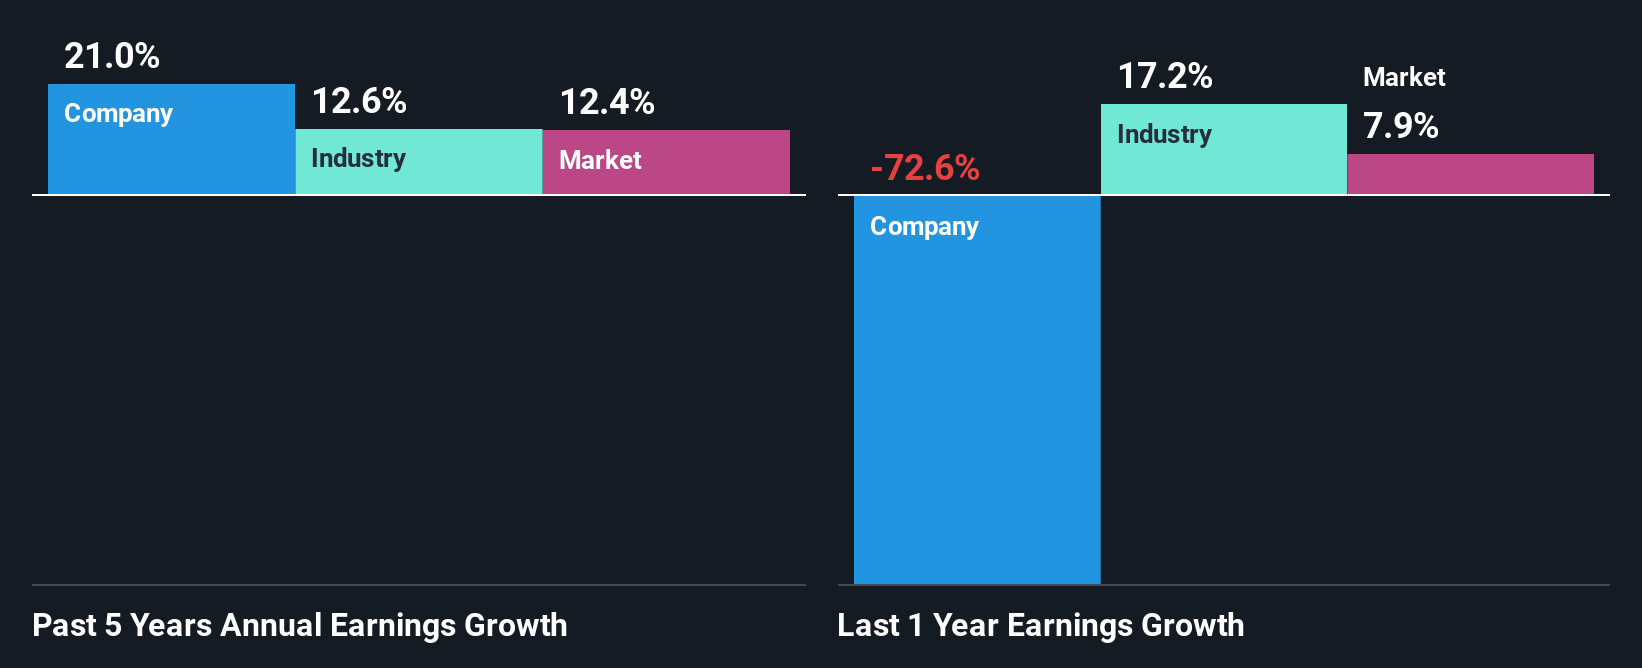
On the face of it, DRAFT's ROE is not much to talk about. A quick further study shows that the company's ROE doesn't compare favorably to the industry average of 16% either. Despite this, surprisingly, DRAFT saw an exceptional 21% net income growth over the past five years. We reckon that there could be other factors at play here. Such as - high earnings retention or an efficient management in place.
We then compared DRAFT's net income growth with the industry and we're pleased to see that the company's growth figure is higher when compared with the industry which has a growth rate of 13% in the same 5-year period.
Earnings growth is a huge factor in stock valuation. The investor should try to establish if the expected growth or decline in earnings, whichever the case may be, is priced in. This then helps them determine if the stock is placed for a bright or bleak future. One good indicator of expected earnings growth is the P/E ratio which determines the price the market is willing to pay for a stock based on its earnings prospects. So, you may want to check if DRAFT is trading on a high P/E or a low P/E, relative to its industry.
Is DRAFT Efficiently Re-investing Its Profits?
DRAFT's three-year median payout ratio to shareholders is 14%, which is quite low. This implies that the company is retaining 86% of its profits. So it looks like DRAFT is reinvesting profits heavily to grow its business, which shows in its earnings growth.
Besides, DRAFT has been paying dividends over a period of five years. This shows that the company is committed to sharing profits with its shareholders.
Conclusion
On the whole, we do feel that DRAFT has some positive attributes. Despite its low rate of return, the fact that the company reinvests a very high portion of its profits into its business, no doubt contributed to its high earnings growth. While we won't completely dismiss the company, what we would do, is try to ascertain how risky the business is to make a more informed decision around the company. You can see the 3 risks we have identified for DRAFT by visiting our risks dashboard for free on our platform here.
New: Manage All Your Stock Portfolios in One Place
We've created the ultimate portfolio companion for stock investors, and it's free.
• Connect an unlimited number of Portfolios and see your total in one currency
• Be alerted to new Warning Signs or Risks via email or mobile
• Track the Fair Value of your stocks
Have feedback on this article? Concerned about the content? Get in touch with us directly. Alternatively, email editorial-team (at) simplywallst.com.
This article by Simply Wall St is general in nature. We provide commentary based on historical data and analyst forecasts only using an unbiased methodology and our articles are not intended to be financial advice. It does not constitute a recommendation to buy or sell any stock, and does not take account of your objectives, or your financial situation. We aim to bring you long-term focused analysis driven by fundamental data. Note that our analysis may not factor in the latest price-sensitive company announcements or qualitative material. Simply Wall St has no position in any stocks mentioned.
About TSE:5070
Adequate balance sheet and slightly overvalued.
Market Insights


Advertisement
Community Narratives
America Wants Homegrown Drones — Draganfly Is Ready to Deliver
Fair Value US$9.21|33.9% undervalued
JO
Community Contributor
Cheesecake Factory offers an enticing opportunity for long-term growth by leveraging new concepts
Fair Value US$73.83|26.5% undervalued
ZW
Community Contributor
Coca-Cola’s Intrinsic Value Set to Rise with Fed Rate Cut
Fair Value US$67.50|2.3% undervalued
AL
Community Contributor
Fully Permitted Gold Mine with 50 Baggers Potential 
Fair Value CA$41.00|98.0% undervalued
RO
Community Contributor