- Japan
- /
- Professional Services
- /
- TSE:4194
Is Visional, Inc.'s (TSE:4194) Stock's Recent Performance Being Led By Its Attractive Financial Prospects?


Visional (TSE:4194) has had a great run on the share market with its stock up by a significant 8.4% over the last month. Given that the market rewards strong financials in the long-term, we wonder if that is the case in this instance. Particularly, we will be paying attention to Visional's ROE today.
ROE or return on equity is a useful tool to assess how effectively a company can generate returns on the investment it received from its shareholders. In other words, it is a profitability ratio which measures the rate of return on the capital provided by the company's shareholders.
How Is ROE Calculated?
The formula for return on equity is:
Return on Equity = Net Profit (from continuing operations) ÷ Shareholders' Equity
So, based on the above formula, the ROE for Visional is:
23% = JP¥13b ÷ JP¥59b (Based on the trailing twelve months to January 2025).
The 'return' is the profit over the last twelve months. One way to conceptualize this is that for each ¥1 of shareholders' capital it has, the company made ¥0.23 in profit.
See our latest analysis for Visional
What Is The Relationship Between ROE And Earnings Growth?
So far, we've learned that ROE is a measure of a company's profitability. Based on how much of its profits the company chooses to reinvest or "retain", we are then able to evaluate a company's future ability to generate profits. Assuming everything else remains unchanged, the higher the ROE and profit retention, the higher the growth rate of a company compared to companies that don't necessarily bear these characteristics.
A Side By Side comparison of Visional's Earnings Growth And 23% ROE
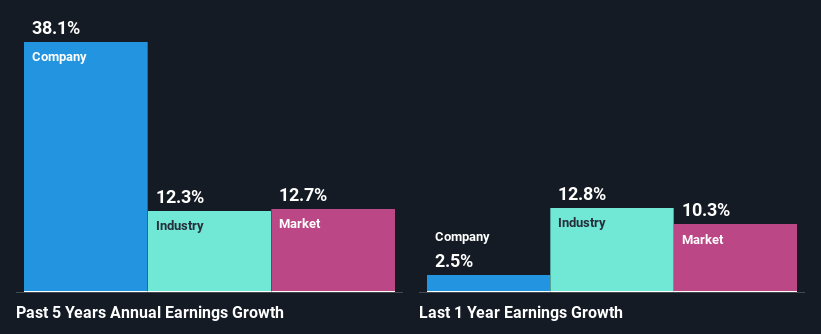
To begin with, Visional has a pretty high ROE which is interesting. Additionally, the company's ROE is higher compared to the industry average of 15% which is quite remarkable. Under the circumstances, Visional's considerable five year net income growth of 38% was to be expected.
Next, on comparing with the industry net income growth, we found that Visional's growth is quite high when compared to the industry average growth of 12% in the same period, which is great to see.
Earnings growth is a huge factor in stock valuation. It’s important for an investor to know whether the market has priced in the company's expected earnings growth (or decline). Doing so will help them establish if the stock's future looks promising or ominous. If you're wondering about Visional's's valuation, check out this gauge of its price-to-earnings ratio , as compared to its industry.
Is Visional Making Efficient Use Of Its Profits?
Visional doesn't pay any regular dividends currently which essentially means that it has been reinvesting all of its profits into the business. This definitely contributes to the high earnings growth number that we discussed above.
Summary
On the whole, we feel that Visional's performance has been quite good. Particularly, we like that the company is reinvesting heavily into its business, and at a high rate of return. Unsurprisingly, this has led to an impressive earnings growth. With that said, the latest industry analyst forecasts reveal that the company's earnings growth is expected to slow down. Are these analysts expectations based on the broad expectations for the industry, or on the company's fundamentals? Click here to be taken to our analyst's forecasts page for the company.
If you're looking to trade Visional, open an account with the lowest-cost platform trusted by professionals, Interactive Brokers.
With clients in over 200 countries and territories, and access to 160 markets, IBKR lets you trade stocks, options, futures, forex, bonds and funds from a single integrated account.
Enjoy no hidden fees, no account minimums, and FX conversion rates as low as 0.03%, far better than what most brokers offer.
Sponsored ContentNew: Manage All Your Stock Portfolios in One Place
We've created the ultimate portfolio companion for stock investors, and it's free.
• Connect an unlimited number of Portfolios and see your total in one currency
• Be alerted to new Warning Signs or Risks via email or mobile
• Track the Fair Value of your stocks
Have feedback on this article? Concerned about the content? Get in touch with us directly. Alternatively, email editorial-team (at) simplywallst.com.
This article by Simply Wall St is general in nature. We provide commentary based on historical data and analyst forecasts only using an unbiased methodology and our articles are not intended to be financial advice. It does not constitute a recommendation to buy or sell any stock, and does not take account of your objectives, or your financial situation. We aim to bring you long-term focused analysis driven by fundamental data. Note that our analysis may not factor in the latest price-sensitive company announcements or qualitative material. Simply Wall St has no position in any stocks mentioned.
About TSE:4194
Reasonable growth potential with adequate balance sheet.
Market Insights

Community Narratives

