- Japan
- /
- Professional Services
- /
- TSE:3474
Further Upside For G-Factory Co.,Ltd. (TSE:3474) Shares Could Introduce Price Risks After 35% Bounce


G-Factory Co.,Ltd. (TSE:3474) shareholders have had their patience rewarded with a 35% share price jump in the last month. Looking further back, the 12% rise over the last twelve months isn't too bad notwithstanding the strength over the last 30 days.
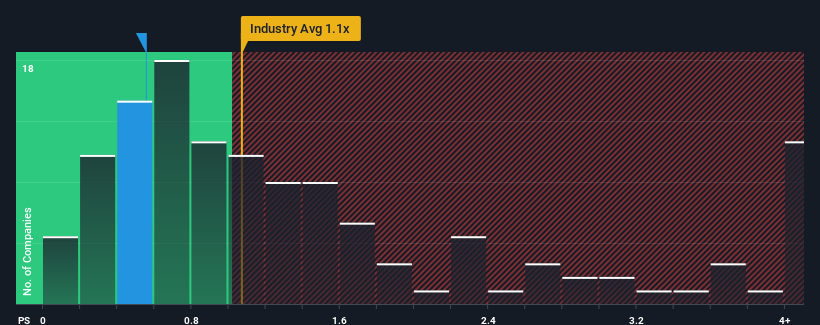
Even after such a large jump in price, when close to half the companies operating in Japan's Professional Services industry have price-to-sales ratios (or "P/S") above 1.1x, you may still consider G-FactoryLtd as an enticing stock to check out with its 0.6x P/S ratio. Nonetheless, we'd need to dig a little deeper to determine if there is a rational basis for the reduced P/S.
Check out our latest analysis for G-FactoryLtd
What Does G-FactoryLtd's Recent Performance Look Like?
G-FactoryLtd has been doing a good job lately as it's been growing revenue at a solid pace. Perhaps the market is expecting this acceptable revenue performance to take a dive, which has kept the P/S suppressed. If you like the company, you'd be hoping this isn't the case so that you could potentially pick up some stock while it's out of favour.
Although there are no analyst estimates available for G-FactoryLtd, take a look at this free data-rich visualisation to see how the company stacks up on earnings, revenue and cash flow.How Is G-FactoryLtd's Revenue Growth Trending?
The only time you'd be truly comfortable seeing a P/S as low as G-FactoryLtd's is when the company's growth is on track to lag the industry.
Taking a look back first, we see that the company grew revenue by an impressive 18% last year. The strong recent performance means it was also able to grow revenue by 41% in total over the last three years. Therefore, it's fair to say the revenue growth recently has been superb for the company.
Comparing that to the industry, which is only predicted to deliver 5.8% growth in the next 12 months, the company's momentum is stronger based on recent medium-term annualised revenue results.
In light of this, it's peculiar that G-FactoryLtd's P/S sits below the majority of other companies. It looks like most investors are not convinced the company can maintain its recent growth rates.
The Bottom Line On G-FactoryLtd's P/S
Despite G-FactoryLtd's share price climbing recently, its P/S still lags most other companies. It's argued the price-to-sales ratio is an inferior measure of value within certain industries, but it can be a powerful business sentiment indicator.
We're very surprised to see G-FactoryLtd currently trading on a much lower than expected P/S since its recent three-year growth is higher than the wider industry forecast. When we see robust revenue growth that outpaces the industry, we presume that there are notable underlying risks to the company's future performance, which is exerting downward pressure on the P/S ratio. At least price risks look to be very low if recent medium-term revenue trends continue, but investors seem to think future revenue could see a lot of volatility.
Before you settle on your opinion, we've discovered 2 warning signs for G-FactoryLtd (1 shouldn't be ignored!) that you should be aware of.
Of course, profitable companies with a history of great earnings growth are generally safer bets. So you may wish to see this free collection of other companies that have reasonable P/E ratios and have grown earnings strongly.
If you're looking to trade G-FactoryLtd, open an account with the lowest-cost platform trusted by professionals, Interactive Brokers.
With clients in over 200 countries and territories, and access to 160 markets, IBKR lets you trade stocks, options, futures, forex, bonds and funds from a single integrated account.
Enjoy no hidden fees, no account minimums, and FX conversion rates as low as 0.03%, far better than what most brokers offer.
Sponsored ContentNew: Manage All Your Stock Portfolios in One Place
We've created the ultimate portfolio companion for stock investors, and it's free.
• Connect an unlimited number of Portfolios and see your total in one currency
• Be alerted to new Warning Signs or Risks via email or mobile
• Track the Fair Value of your stocks
Have feedback on this article? Concerned about the content? Get in touch with us directly. Alternatively, email editorial-team (at) simplywallst.com.
This article by Simply Wall St is general in nature. We provide commentary based on historical data and analyst forecasts only using an unbiased methodology and our articles are not intended to be financial advice. It does not constitute a recommendation to buy or sell any stock, and does not take account of your objectives, or your financial situation. We aim to bring you long-term focused analysis driven by fundamental data. Note that our analysis may not factor in the latest price-sensitive company announcements or qualitative material. Simply Wall St has no position in any stocks mentioned.
About TSE:3474
G-FactoryLtd
Engages in the provision of management support services for restaurants.
Adequate balance sheet and slightly overvalued.
Similar Companies
Market Insights

Community Narratives


