- Japan
- /
- Specialty Stores
- /
- TSE:2674
Exploring WDB Holdings And Two Additional Prominent Dividend Stocks

Reviewed by Simply Wall St

As global markets experience varied performance, with Japan's Nikkei 225 Index recently facing a slight decline amid broader economic fluctuations, investors are increasingly attentive to opportunities that offer potential stability and returns. In this context, dividend stocks like WDB Holdings in Japan emerge as particularly compelling, given their potential to provide steady income streams against the backdrop of ongoing market adjustments and economic data releases.
Top 10 Dividend Stocks In Japan
| Name | Dividend Yield | Dividend Rating |
| Yamato Kogyo (TSE:5444) | 3.69% | ★★★★★★ |
| Mitsubishi Shokuhin (TSE:7451) | 3.59% | ★★★★★★ |
| Business Brain Showa-Ota (TSE:9658) | 3.68% | ★★★★★★ |
| Globeride (TSE:7990) | 3.96% | ★★★★★★ |
| HITO-Communications HoldingsInc (TSE:4433) | 3.65% | ★★★★★★ |
| Ryoyu Systems (TSE:4685) | 3.56% | ★★★★★★ |
| FALCO HOLDINGS (TSE:4671) | 3.51% | ★★★★★★ |
| Mitsubishi Research Institute (TSE:3636) | 3.47% | ★★★★★★ |
| GakkyushaLtd (TSE:9769) | 4.18% | ★★★★★★ |
| Innotech (TSE:9880) | 4.09% | ★★★★★★ |
Click here to see the full list of 389 stocks from our Top Dividend Stocks screener.
Let's dive into some prime choices out of from the screener.
WDB Holdings (TSE:2475)
Simply Wall St Dividend Rating: ★★★★★☆
Overview: WDB Holdings Co., Ltd., with a market capitalization of ¥33.74 billion, operates in human resources, contract research (CRO), and various other platforms within Japan.
Operations: WDB Holdings Co., Ltd. generates revenue primarily through its Human Resource Services and CRO segments, with respective earnings of ¥42.16 billion and ¥7.18 billion.
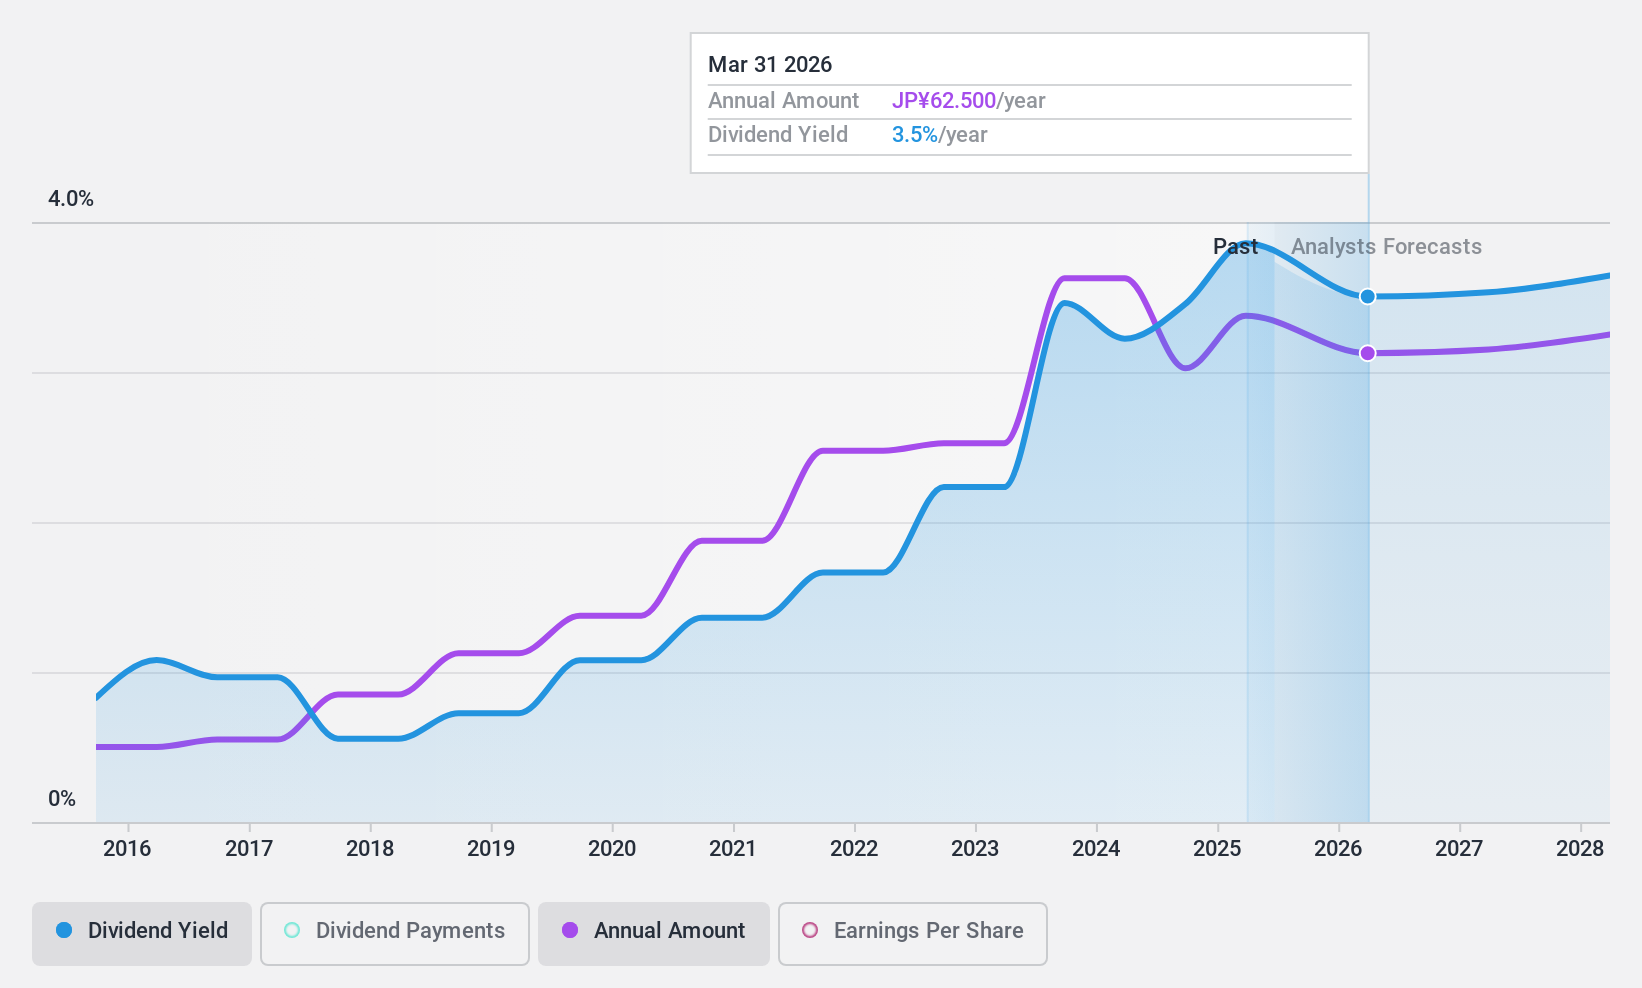
Dividend Yield: 3.5%
WDB Holdings, trading at ¥59.4% below our fair value estimate, offers a dividend yield of 3.52%, ranking in the top 25% in the Japanese market. Despite its attractive pricing and high yield, the company's dividend history is marred by instability and volatility over the past decade. However, both earnings and cash flows provide solid coverage for dividends, with payout ratios of 40.1% and 31.9%, respectively. Recent executive changes could signal shifts in company strategy or focus going forward.
- Click here to discover the nuances of WDB Holdings with our detailed analytical dividend report.
- Insights from our recent valuation report point to the potential undervaluation of WDB Holdings shares in the market.
Hard Off CorporationLtd (TSE:2674)
Simply Wall St Dividend Rating: ★★★★☆☆
Overview: Hard Off Corporation Ltd. operates a chain of reuse shops across Japan and has a market capitalization of approximately ¥28.00 billion.
Operations: Hard Off Corporation Ltd. generates revenue primarily through its Secondhand Business, which brought in ¥28.50 billion, and its FC Business, with revenues of ¥1.97 billion.
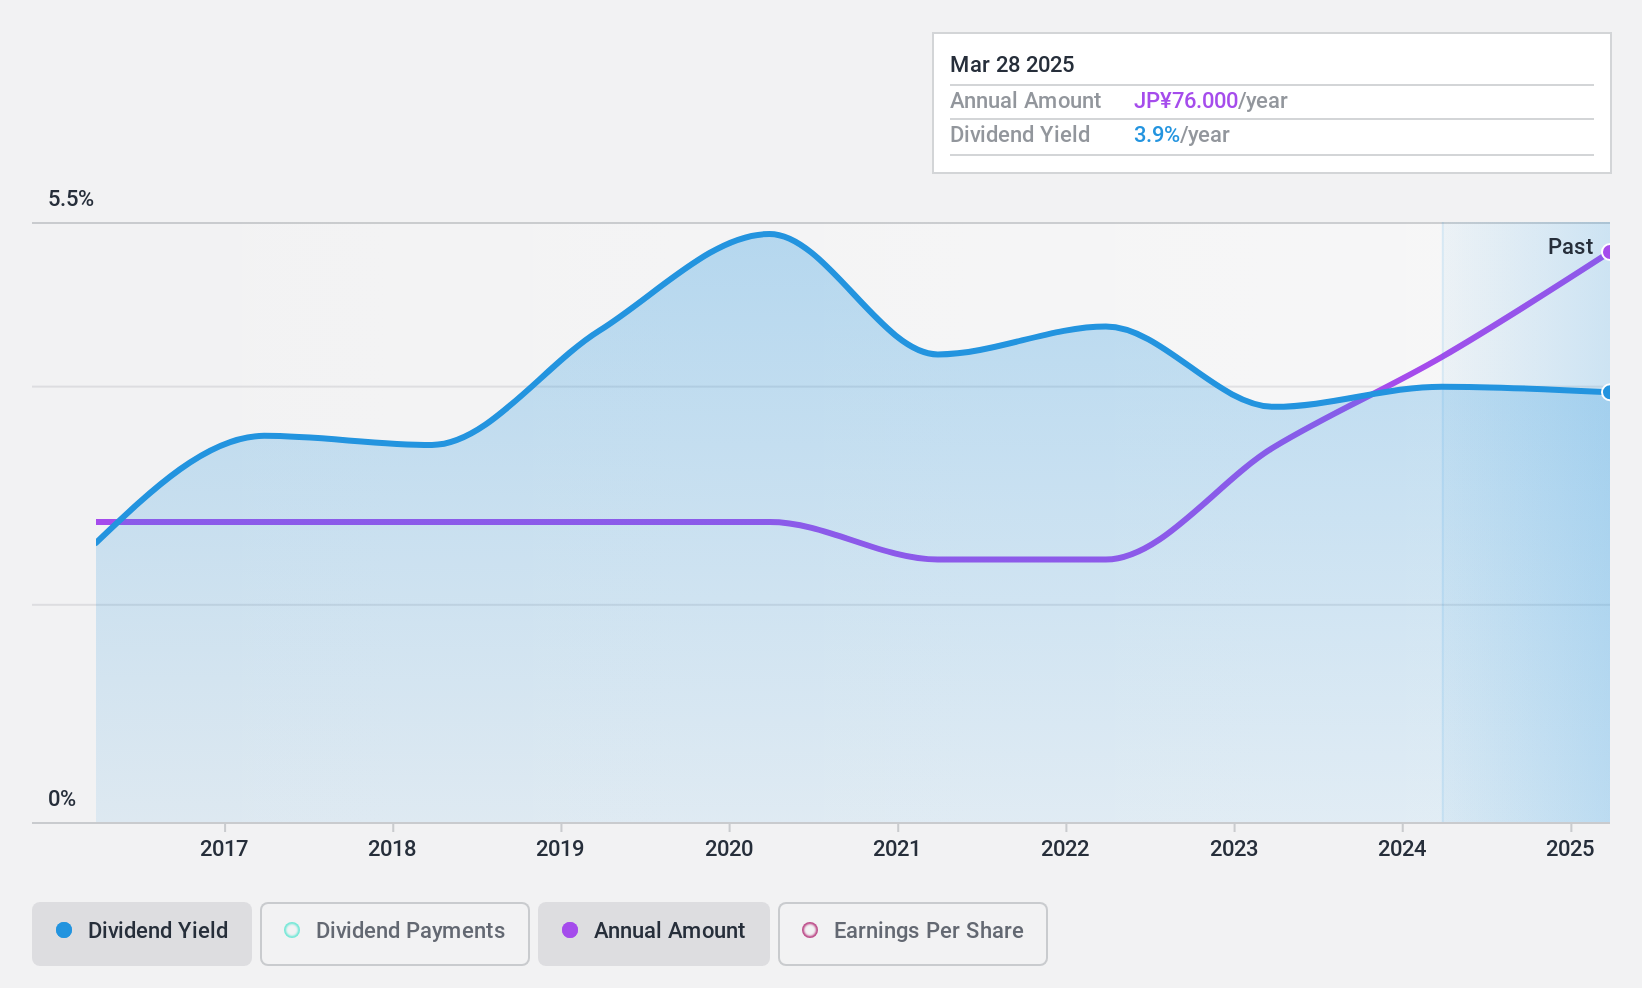
Dividend Yield: 3.7%
Hard Off Corporation Co., Ltd. has demonstrated a commitment to increasing its dividends, with a recent hike to ¥76.00 per share from the previous year's ¥60.00. Despite this growth, the sustainability of these payments is questionable; both earnings and cash flows struggle to cover the dividend, evidenced by a high cash payout ratio of 143.2%. Additionally, while its dividend yield of 3.7% stands above the Japanese market average, it has experienced significant volatility over the past decade. The company projects robust financial performance in upcoming periods with expected substantial increases in net sales and profits by March 2025.
- Take a closer look at Hard Off CorporationLtd's potential here in our dividend report.
- Our expertly prepared valuation report Hard Off CorporationLtd implies its share price may be too high.
SK-ElectronicsLTD (TSE:6677)
Simply Wall St Dividend Rating: ★★★★☆☆
Overview: SK-Electronics CO., LTD. (TSE: 6677) focuses on manufacturing and selling large-format photomasks, serving markets both in Japan and internationally, with a market capitalization of ¥30.97 billion.
Operations: SK-Electronics CO., LTD. generates its revenues primarily through the production and sale of large-format photomasks across various global markets.
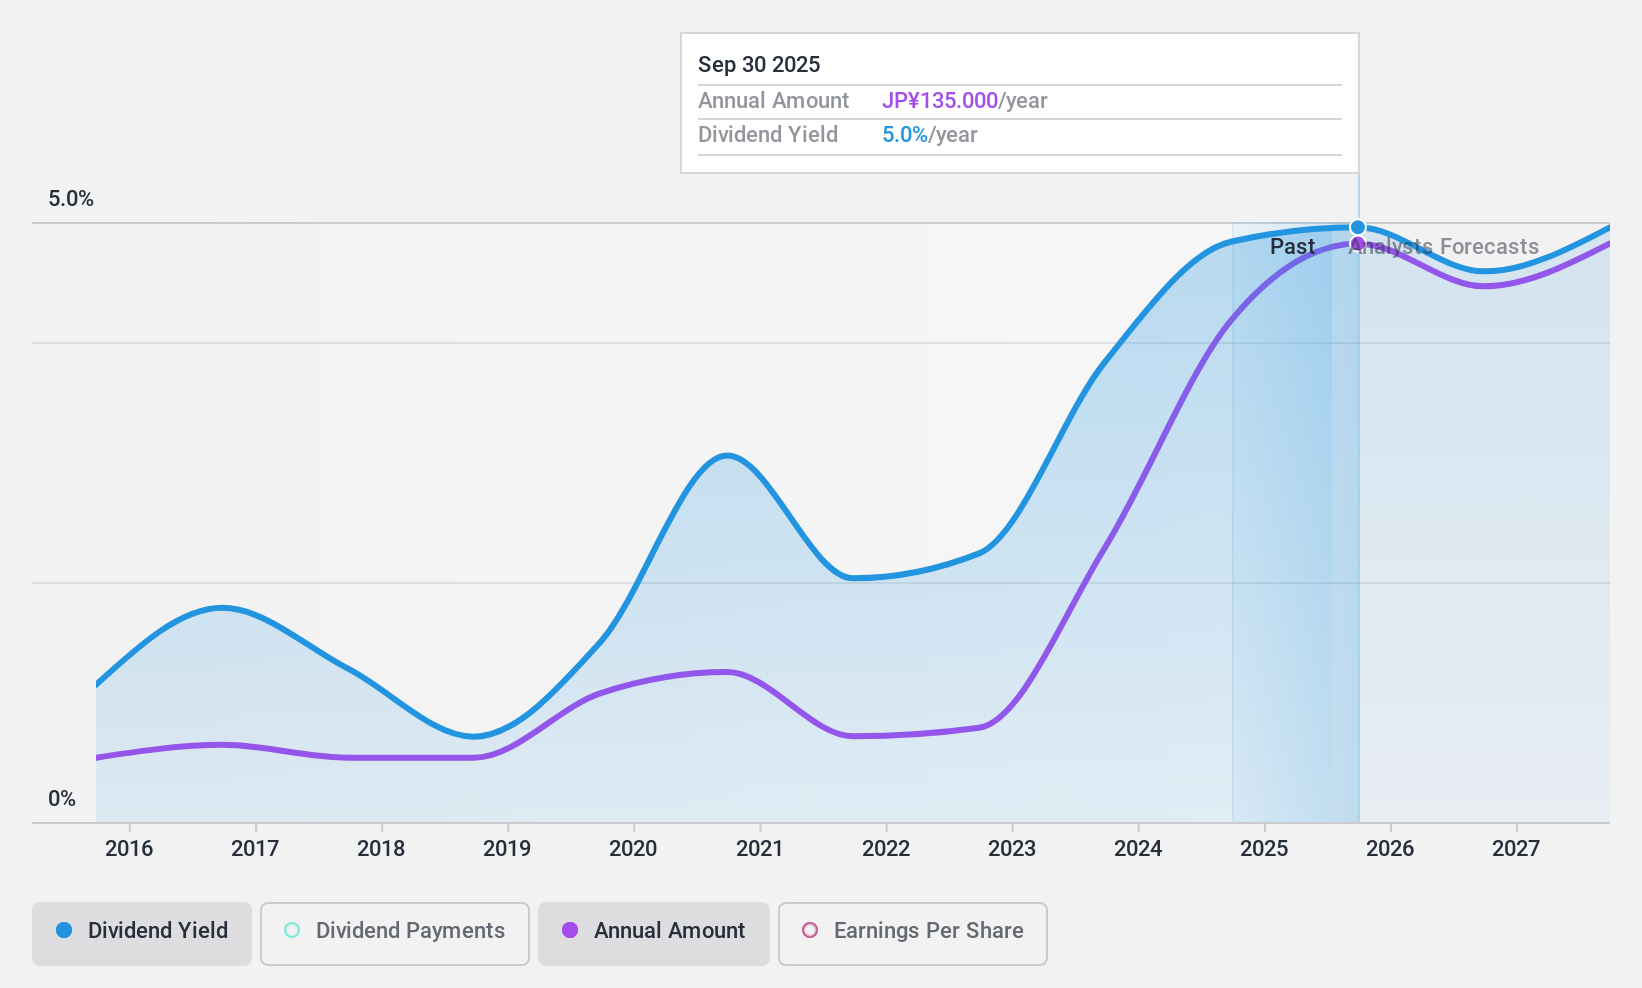
Dividend Yield: 5.5%
SK-Electronics LTD offers a dividend yield of 5.54%, ranking it in the top 25% of Japanese dividend payers, but its sustainability is questionable due to a high cash payout ratio of 90.8%. Despite dividends being covered by earnings with a reasonable payout ratio of 64.1%, the volatility and unreliable growth over the past decade raise concerns about future reliability. Additionally, while trading at a price-to-earnings ratio of 11.9x, below the market average, forecasted earnings growth remains modest at 2.79% per year.
- Delve into the full analysis dividend report here for a deeper understanding of SK-ElectronicsLTD.
- In light of our recent valuation report, it seems possible that SK-ElectronicsLTD is trading behind its estimated value.
Key Takeaways
- Click this link to deep-dive into the 389 companies within our Top Dividend Stocks screener.
- Got skin in the game with these stocks? Elevate how you manage them by using Simply Wall St's portfolio, where intuitive tools await to help optimize your investment outcomes.
- Discover a world of investment opportunities with Simply Wall St's free app and access unparalleled stock analysis across all markets.
Looking For Alternative Opportunities?
- Explore high-performing small cap companies that haven't yet garnered significant analyst attention.
- Fuel your portfolio with companies showing strong growth potential, backed by optimistic outlooks both from analysts and management.
- Find companies with promising cash flow potential yet trading below their fair value.
This article by Simply Wall St is general in nature. We provide commentary based on historical data and analyst forecasts only using an unbiased methodology and our articles are not intended to be financial advice. It does not constitute a recommendation to buy or sell any stock, and does not take account of your objectives, or your financial situation. We aim to bring you long-term focused analysis driven by fundamental data. Note that our analysis may not factor in the latest price-sensitive company announcements or qualitative material. Simply Wall St has no position in any stocks mentioned.
If you're looking to trade Hard Off CorporationLtd, open an account with the lowest-cost platform trusted by professionals, Interactive Brokers.
With clients in over 200 countries and territories, and access to 160 markets, IBKR lets you trade stocks, options, futures, forex, bonds and funds from a single integrated account.
Enjoy no hidden fees, no account minimums, and FX conversion rates as low as 0.03%, far better than what most brokers offer.
Sponsored ContentValuation is complex, but we're here to simplify it.
Discover if Hard Off CorporationLtd might be undervalued or overvalued with our detailed analysis, featuring fair value estimates, potential risks, dividends, insider trades, and its financial condition.
Access Free AnalysisHave feedback on this article? Concerned about the content? Get in touch with us directly. Alternatively, email editorial-team@simplywallst.com
About TSE:2674
Excellent balance sheet with proven track record and pays a dividend.
