

Howard Marks put it nicely when he said that, rather than worrying about share price volatility, 'The possibility of permanent loss is the risk I worry about... and every practical investor I know worries about.' So it might be obvious that you need to consider debt, when you think about how risky any given stock is, because too much debt can sink a company. As with many other companies SMS Co., Ltd. (TSE:2175) makes use of debt. But is this debt a concern to shareholders?
Why Does Debt Bring Risk?
Debt assists a business until the business has trouble paying it off, either with new capital or with free cash flow. If things get really bad, the lenders can take control of the business. While that is not too common, we often do see indebted companies permanently diluting shareholders because lenders force them to raise capital at a distressed price. By replacing dilution, though, debt can be an extremely good tool for businesses that need capital to invest in growth at high rates of return. The first thing to do when considering how much debt a business uses is to look at its cash and debt together.
See our latest analysis for SMS
What Is SMS's Net Debt?
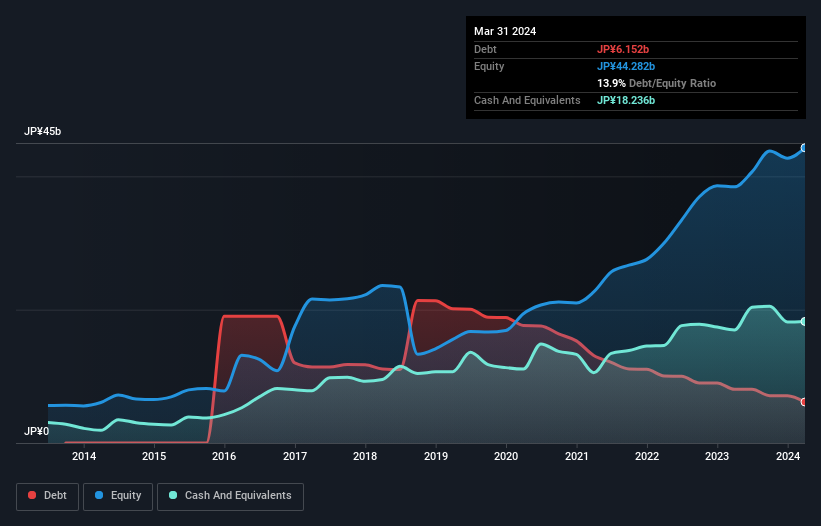
As you can see below, SMS had JP¥6.15b of debt at March 2024, down from JP¥8.05b a year prior. But on the other hand it also has JP¥18.2b in cash, leading to a JP¥12.1b net cash position.
How Healthy Is SMS' Balance Sheet?
The latest balance sheet data shows that SMS had liabilities of JP¥21.3b due within a year, and liabilities of JP¥6.87b falling due after that. Offsetting these obligations, it had cash of JP¥18.2b as well as receivables valued at JP¥18.4b due within 12 months. So it can boast JP¥8.41b more liquid assets than total liabilities.
This surplus suggests that SMS has a conservative balance sheet, and could probably eliminate its debt without much difficulty. Simply put, the fact that SMS has more cash than debt is arguably a good indication that it can manage its debt safely.
Also good is that SMS grew its EBIT at 14% over the last year, further increasing its ability to manage debt. There's no doubt that we learn most about debt from the balance sheet. But it is future earnings, more than anything, that will determine SMS's ability to maintain a healthy balance sheet going forward. So if you want to see what the professionals think, you might find this free report on analyst profit forecasts to be interesting.
Finally, a company can only pay off debt with cold hard cash, not accounting profits. While SMS has net cash on its balance sheet, it's still worth taking a look at its ability to convert earnings before interest and tax (EBIT) to free cash flow, to help us understand how quickly it is building (or eroding) that cash balance. During the last three years, SMS generated free cash flow amounting to a very robust 89% of its EBIT, more than we'd expect. That puts it in a very strong position to pay down debt.
Summing Up
While it is always sensible to investigate a company's debt, in this case SMS has JP¥12.1b in net cash and a decent-looking balance sheet. The cherry on top was that in converted 89% of that EBIT to free cash flow, bringing in JP¥6.1b. So is SMS's debt a risk? It doesn't seem so to us. Above most other metrics, we think its important to track how fast earnings per share is growing, if at all. If you've also come to that realization, you're in luck, because today you can view this interactive graph of SMS's earnings per share history for free.
If you're interested in investing in businesses that can grow profits without the burden of debt, then check out this free list of growing businesses that have net cash on the balance sheet.
If you're looking to trade SMS, open an account with the lowest-cost platform trusted by professionals, Interactive Brokers.
With clients in over 200 countries and territories, and access to 160 markets, IBKR lets you trade stocks, options, futures, forex, bonds and funds from a single integrated account.
Enjoy no hidden fees, no account minimums, and FX conversion rates as low as 0.03%, far better than what most brokers offer.
Sponsored ContentNew: Manage All Your Stock Portfolios in One Place
We've created the ultimate portfolio companion for stock investors, and it's free.
• Connect an unlimited number of Portfolios and see your total in one currency
• Be alerted to new Warning Signs or Risks via email or mobile
• Track the Fair Value of your stocks
Have feedback on this article? Concerned about the content? Get in touch with us directly. Alternatively, email editorial-team (at) simplywallst.com.
This article by Simply Wall St is general in nature. We provide commentary based on historical data and analyst forecasts only using an unbiased methodology and our articles are not intended to be financial advice. It does not constitute a recommendation to buy or sell any stock, and does not take account of your objectives, or your financial situation. We aim to bring you long-term focused analysis driven by fundamental data. Note that our analysis may not factor in the latest price-sensitive company announcements or qualitative material. Simply Wall St has no position in any stocks mentioned.
About TSE:2175
SMS
Provides information infrastructure for the nursing care, medical care, career, healthcare, and elderly care field business areas in Japan and internationally.
Flawless balance sheet average dividend payer.
Similar Companies
Market Insights

Community Narratives


