

The external fund manager backed by Berkshire Hathaway's Charlie Munger, Li Lu, makes no bones about it when he says 'The biggest investment risk is not the volatility of prices, but whether you will suffer a permanent loss of capital.' So it seems the smart money knows that debt - which is usually involved in bankruptcies - is a very important factor, when you assess how risky a company is. We can see that SMS Co., Ltd. (TSE:2175) does use debt in its business. But the real question is whether this debt is making the company risky.
What Risk Does Debt Bring?
Debt is a tool to help businesses grow, but if a business is incapable of paying off its lenders, then it exists at their mercy. In the worst case scenario, a company can go bankrupt if it cannot pay its creditors. However, a more common (but still painful) scenario is that it has to raise new equity capital at a low price, thus permanently diluting shareholders. Of course, debt can be an important tool in businesses, particularly capital heavy businesses. The first step when considering a company's debt levels is to consider its cash and debt together.
See our latest analysis for SMS
What Is SMS's Net Debt?
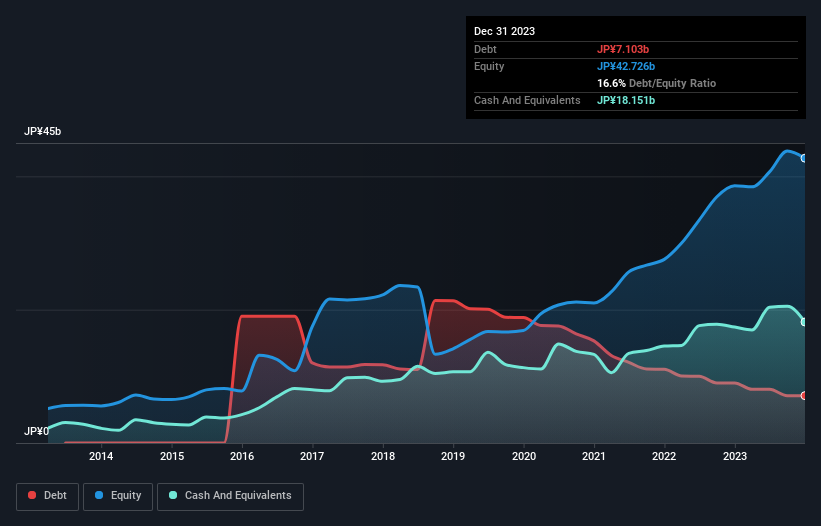
You can click the graphic below for the historical numbers, but it shows that SMS had JP¥7.10b of debt in December 2023, down from JP¥9.00b, one year before. However, its balance sheet shows it holds JP¥18.2b in cash, so it actually has JP¥11.0b net cash.
A Look At SMS' Liabilities
We can see from the most recent balance sheet that SMS had liabilities of JP¥20.4b falling due within a year, and liabilities of JP¥7.92b due beyond that. Offsetting these obligations, it had cash of JP¥18.2b as well as receivables valued at JP¥16.4b due within 12 months. So it actually has JP¥6.20b more liquid assets than total liabilities.
This short term liquidity is a sign that SMS could probably pay off its debt with ease, as its balance sheet is far from stretched. Simply put, the fact that SMS has more cash than debt is arguably a good indication that it can manage its debt safely.
On the other hand, SMS saw its EBIT drop by 3.8% in the last twelve months. That sort of decline, if sustained, will obviously make debt harder to handle. When analysing debt levels, the balance sheet is the obvious place to start. But it is future earnings, more than anything, that will determine SMS's ability to maintain a healthy balance sheet going forward. So if you're focused on the future you can check out this free report showing analyst profit forecasts.
Finally, a company can only pay off debt with cold hard cash, not accounting profits. SMS may have net cash on the balance sheet, but it is still interesting to look at how well the business converts its earnings before interest and tax (EBIT) to free cash flow, because that will influence both its need for, and its capacity to manage debt. During the last three years, SMS generated free cash flow amounting to a very robust 92% of its EBIT, more than we'd expect. That puts it in a very strong position to pay down debt.
Summing Up
While we empathize with investors who find debt concerning, you should keep in mind that SMS has net cash of JP¥11.0b, as well as more liquid assets than liabilities. And it impressed us with free cash flow of JP¥6.2b, being 92% of its EBIT. So is SMS's debt a risk? It doesn't seem so to us. Over time, share prices tend to follow earnings per share, so if you're interested in SMS, you may well want to click here to check an interactive graph of its earnings per share history.
When all is said and done, sometimes its easier to focus on companies that don't even need debt. Readers can access a list of growth stocks with zero net debt 100% free, right now.
New: Manage All Your Stock Portfolios in One Place
We've created the ultimate portfolio companion for stock investors, and it's free.
• Connect an unlimited number of Portfolios and see your total in one currency
• Be alerted to new Warning Signs or Risks via email or mobile
• Track the Fair Value of your stocks
Have feedback on this article? Concerned about the content? Get in touch with us directly. Alternatively, email editorial-team (at) simplywallst.com.
This article by Simply Wall St is general in nature. We provide commentary based on historical data and analyst forecasts only using an unbiased methodology and our articles are not intended to be financial advice. It does not constitute a recommendation to buy or sell any stock, and does not take account of your objectives, or your financial situation. We aim to bring you long-term focused analysis driven by fundamental data. Note that our analysis may not factor in the latest price-sensitive company announcements or qualitative material. Simply Wall St has no position in any stocks mentioned.
About TSE:2175
SMS
Provides information infrastructure for the nursing care, medical care, career, healthcare, and elderly care field business areas in Japan and internationally.
Flawless balance sheet average dividend payer.
Similar Companies
Market Insights

Community Narratives


