The three-year underlying earnings growth at MISUMI Group (TSE:9962) is promising, but the shareholders are still in the red over that time


As an investor its worth striving to ensure your overall portfolio beats the market average. But its virtually certain that sometimes you will buy stocks that fall short of the market average returns. Unfortunately, that's been the case for longer term MISUMI Group Inc. (TSE:9962) shareholders, since the share price is down 33% in the last three years, falling well short of the market return of around 36%. Unfortunately the share price momentum is still quite negative, with prices down 12% in thirty days. We do note, however, that the broader market is down 7.7% in that period, and this may have weighed on the share price.
Given the past week has been tough on shareholders, let's investigate the fundamentals and see what we can learn.
While markets are a powerful pricing mechanism, share prices reflect investor sentiment, not just underlying business performance. One imperfect but simple way to consider how the market perception of a company has shifted is to compare the change in the earnings per share (EPS) with the share price movement.
Although the share price is down over three years, MISUMI Group actually managed to grow EPS by 0.2% per year in that time. This is quite a puzzle, and suggests there might be something temporarily buoying the share price. Alternatively, growth expectations may have been unreasonable in the past.
After considering the numbers, we'd posit that the the market had higher expectations of EPS growth, three years back. Looking to other metrics might better explain the share price change.
With a rather small yield of just 1.9% we doubt that the stock's share price is based on its dividend. With revenue flat over three years, it seems unlikely that the share price is reflecting the top line. There doesn't seem to be any clear correlation between the fundamental business metrics and the share price. That could mean that the stock was previously overrated, or it could spell opportunity now.
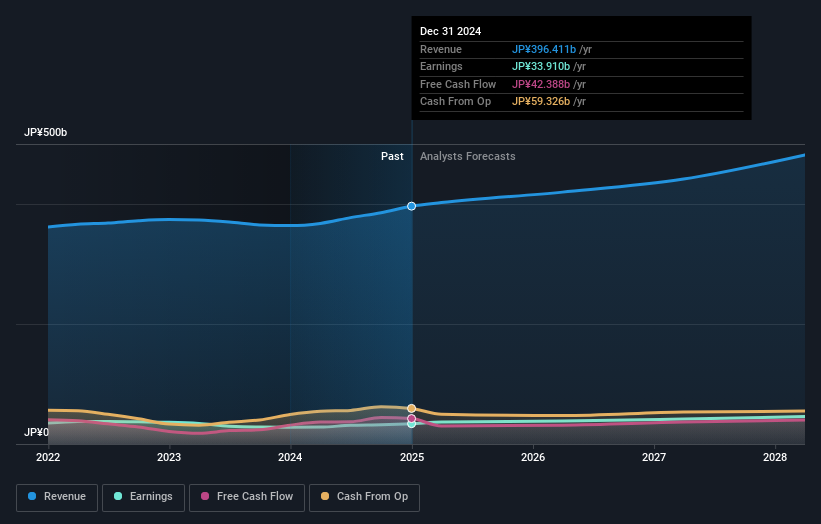
The graphic below depicts how earnings and revenue have changed over time (unveil the exact values by clicking on the image).
We know that MISUMI Group has improved its bottom line lately, but what does the future have in store? If you are thinking of buying or selling MISUMI Group stock, you should check out this free report showing analyst profit forecasts .
What About Dividends?
As well as measuring the share price return, investors should also consider the total shareholder return (TSR). The TSR incorporates the value of any spin-offs or discounted capital raisings, along with any dividends, based on the assumption that the dividends are reinvested. Arguably, the TSR gives a more comprehensive picture of the return generated by a stock. In the case of MISUMI Group, it has a TSR of -30% for the last 3 years. That exceeds its share price return that we previously mentioned. And there's no prize for guessing that the dividend payments largely explain the divergence!
A Different Perspective
Although it hurts that MISUMI Group returned a loss of 1.2% in the last twelve months, the broader market was actually worse, returning a loss of 8.0%. Of far more concern is the 1.7% p.a. loss served to shareholders over the last five years. While the losses are slowing we doubt many shareholders are happy with the stock. It's always interesting to track share price performance over the longer term. But to understand MISUMI Group better, we need to consider many other factors. For example, we've discovered 1 warning sign for MISUMI Group that you should be aware of before investing here.
If you are like me, then you will not want to miss this free list of undervalued small caps that insiders are buying.
Please note, the market returns quoted in this article reflect the market weighted average returns of stocks that currently trade on Japanese exchanges.
If you're looking to trade MISUMI Group, open an account with the lowest-cost platform trusted by professionals, Interactive Brokers.
With clients in over 200 countries and territories, and access to 160 markets, IBKR lets you trade stocks, options, futures, forex, bonds and funds from a single integrated account.
Enjoy no hidden fees, no account minimums, and FX conversion rates as low as 0.03%, far better than what most brokers offer.
Sponsored ContentNew: Manage All Your Stock Portfolios in One Place
We've created the ultimate portfolio companion for stock investors, and it's free.
• Connect an unlimited number of Portfolios and see your total in one currency
• Be alerted to new Warning Signs or Risks via email or mobile
• Track the Fair Value of your stocks
Have feedback on this article? Concerned about the content? Get in touch with us directly. Alternatively, email editorial-team (at) simplywallst.com.
This article by Simply Wall St is general in nature. We provide commentary based on historical data and analyst forecasts only using an unbiased methodology and our articles are not intended to be financial advice. It does not constitute a recommendation to buy or sell any stock, and does not take account of your objectives, or your financial situation. We aim to bring you long-term focused analysis driven by fundamental data. Note that our analysis may not factor in the latest price-sensitive company announcements or qualitative material. Simply Wall St has no position in any stocks mentioned.
About TSE:9962
MISUMI Group
Engages in the factory automation and die components businesses worldwide.
Flawless balance sheet with solid track record.
Market Insights

Community Narratives

