Could The Market Be Wrong About MISUMI Group Inc. (TSE:9962) Given Its Attractive Financial Prospects?


MISUMI Group (TSE:9962) has had a rough three months with its share price down 13%. However, stock prices are usually driven by a company’s financial performance over the long term, which in this case looks quite promising. Specifically, we decided to study MISUMI Group's ROE in this article.
Return on equity or ROE is a key measure used to assess how efficiently a company's management is utilizing the company's capital. In other words, it is a profitability ratio which measures the rate of return on the capital provided by the company's shareholders.
How Do You Calculate Return On Equity?
The formula for ROE is:
Return on Equity = Net Profit (from continuing operations) ÷ Shareholders' Equity
So, based on the above formula, the ROE for MISUMI Group is:
10% = JP¥37b ÷ JP¥352b (Based on the trailing twelve months to March 2025).
The 'return' is the profit over the last twelve months. So, this means that for every ¥1 of its shareholder's investments, the company generates a profit of ¥0.10.
See our latest analysis for MISUMI Group
Why Is ROE Important For Earnings Growth?
We have already established that ROE serves as an efficient profit-generating gauge for a company's future earnings. Depending on how much of these profits the company reinvests or "retains", and how effectively it does so, we are then able to assess a company’s earnings growth potential. Assuming all else is equal, companies that have both a higher return on equity and higher profit retention are usually the ones that have a higher growth rate when compared to companies that don't have the same features.
A Side By Side comparison of MISUMI Group's Earnings Growth And 10% ROE
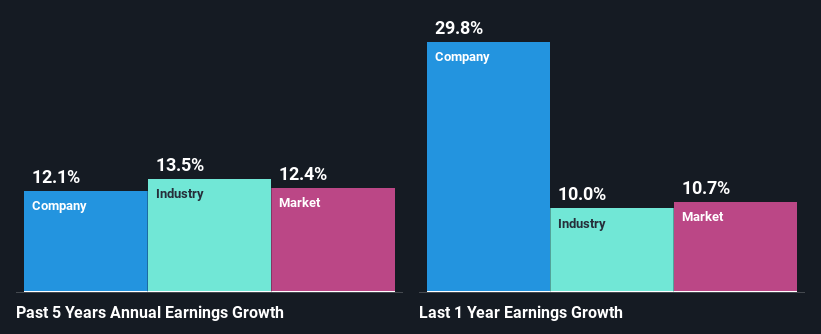
At first glance, MISUMI Group seems to have a decent ROE. Further, the company's ROE compares quite favorably to the industry average of 7.5%. This certainly adds some context to MISUMI Group's decent 12% net income growth seen over the past five years.
We then performed a comparison between MISUMI Group's net income growth with the industry, which revealed that the company's growth is similar to the average industry growth of 14% in the same 5-year period.
Earnings growth is an important metric to consider when valuing a stock. The investor should try to establish if the expected growth or decline in earnings, whichever the case may be, is priced in. Doing so will help them establish if the stock's future looks promising or ominous. Is 9962 fairly valued? This infographic on the company's intrinsic value has everything you need to know.
Is MISUMI Group Efficiently Re-investing Its Profits?
MISUMI Group has a healthy combination of a moderate three-year median payout ratio of 25% (or a retention ratio of 75%) and a respectable amount of growth in earnings as we saw above, meaning that the company has been making efficient use of its profits.
Besides, MISUMI Group has been paying dividends for at least ten years or more. This shows that the company is committed to sharing profits with its shareholders.
Conclusion
On the whole, we feel that MISUMI Group's performance has been quite good. Particularly, we like that the company is reinvesting heavily into its business, and at a high rate of return. Unsurprisingly, this has led to an impressive earnings growth. Having said that, the company's earnings growth is expected to slow down, as forecasted in the current analyst estimates. Are these analysts expectations based on the broad expectations for the industry, or on the company's fundamentals? Click here to be taken to our analyst's forecasts page for the company.
New: Manage All Your Stock Portfolios in One Place
We've created the ultimate portfolio companion for stock investors, and it's free.
• Connect an unlimited number of Portfolios and see your total in one currency
• Be alerted to new Warning Signs or Risks via email or mobile
• Track the Fair Value of your stocks
Have feedback on this article? Concerned about the content? Get in touch with us directly. Alternatively, email editorial-team (at) simplywallst.com.
This article by Simply Wall St is general in nature. We provide commentary based on historical data and analyst forecasts only using an unbiased methodology and our articles are not intended to be financial advice. It does not constitute a recommendation to buy or sell any stock, and does not take account of your objectives, or your financial situation. We aim to bring you long-term focused analysis driven by fundamental data. Note that our analysis may not factor in the latest price-sensitive company announcements or qualitative material. Simply Wall St has no position in any stocks mentioned.
About TSE:9962
MISUMI Group
Engages in the factory automation and die components businesses worldwide.
Flawless balance sheet with solid track record and pays a dividend.
Market Insights

Community Narratives


