

Unsurprisingly, Ohba Co., Ltd.'s (TSE:9765) stock price was strong on the back of its healthy earnings report. However, our analysis suggests that shareholders may be missing some factors that indicate the earnings result was not as good as it looked.
View our latest analysis for Ohba
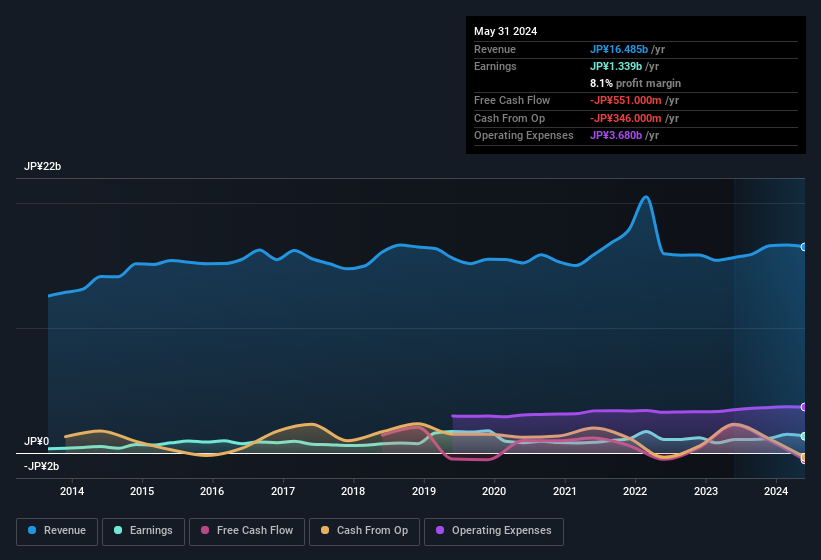
Examining Cashflow Against Ohba's Earnings
As finance nerds would already know, the accrual ratio from cashflow is a key measure for assessing how well a company's free cash flow (FCF) matches its profit. To get the accrual ratio we first subtract FCF from profit for a period, and then divide that number by the average operating assets for the period. This ratio tells us how much of a company's profit is not backed by free cashflow.
Therefore, it's actually considered a good thing when a company has a negative accrual ratio, but a bad thing if its accrual ratio is positive. That is not intended to imply we should worry about a positive accrual ratio, but it's worth noting where the accrual ratio is rather high. That's because some academic studies have suggested that high accruals ratios tend to lead to lower profit or less profit growth.
For the year to May 2024, Ohba had an accrual ratio of 0.23. Therefore, we know that it's free cashflow was significantly lower than its statutory profit, which is hardly a good thing. Over the last year it actually had negative free cash flow of JP¥551m, in contrast to the aforementioned profit of JP¥1.34b. We saw that FCF was JP¥2.2b a year ago though, so Ohba has at least been able to generate positive FCF in the past. The good news for shareholders is that Ohba's accrual ratio was much better last year, so this year's poor reading might simply be a case of a short term mismatch between profit and FCF. As a result, some shareholders may be looking for stronger cash conversion in the current year.
Note: we always recommend investors check balance sheet strength. Click here to be taken to our balance sheet analysis of Ohba.
Our Take On Ohba's Profit Performance
Ohba's accrual ratio for the last twelve months signifies cash conversion is less than ideal, which is a negative when it comes to our view of its earnings. Because of this, we think that it may be that Ohba's statutory profits are better than its underlying earnings power. Nonetheless, it's still worth noting that its earnings per share have grown at 61% over the last three years. Of course, we've only just scratched the surface when it comes to analysing its earnings; one could also consider margins, forecast growth, and return on investment, among other factors. Keep in mind, when it comes to analysing a stock it's worth noting the risks involved. To help with this, we've discovered 3 warning signs (2 are significant!) that you ought to be aware of before buying any shares in Ohba.
Today we've zoomed in on a single data point to better understand the nature of Ohba's profit. But there are plenty of other ways to inform your opinion of a company. For example, many people consider a high return on equity as an indication of favorable business economics, while others like to 'follow the money' and search out stocks that insiders are buying. While it might take a little research on your behalf, you may find this free collection of companies boasting high return on equity, or this list of stocks with significant insider holdings to be useful.
New: AI Stock Screener & Alerts
Our new AI Stock Screener scans the market every day to uncover opportunities.
• Dividend Powerhouses (3%+ Yield)
• Undervalued Small Caps with Insider Buying
• High growth Tech and AI Companies
Or build your own from over 50 metrics.
Have feedback on this article? Concerned about the content? Get in touch with us directly. Alternatively, email editorial-team (at) simplywallst.com.
This article by Simply Wall St is general in nature. We provide commentary based on historical data and analyst forecasts only using an unbiased methodology and our articles are not intended to be financial advice. It does not constitute a recommendation to buy or sell any stock, and does not take account of your objectives, or your financial situation. We aim to bring you long-term focused analysis driven by fundamental data. Note that our analysis may not factor in the latest price-sensitive company announcements or qualitative material. Simply Wall St has no position in any stocks mentioned.
Have feedback on this article? Concerned about the content? Get in touch with us directly. Alternatively, email editorial-team@simplywallst.com
About TSE:9765
Solid track record with excellent balance sheet and pays a dividend.
