- Japan
- /
- Trade Distributors
- /
- TSE:8031
Mitsui (TSE:8031) jumps 9.1% this week, though earnings growth is still tracking behind five-year shareholder returns


Mitsui & Co., Ltd. (TSE:8031) shareholders might be concerned after seeing the share price drop 26% in the last quarter. But that scarcely detracts from the really solid long term returns generated by the company over five years. In fact, the share price is 286% higher today. So while it's never fun to see a share price fall, it's important to look at a longer time horizon. Ultimately business performance will determine whether the stock price continues the positive long term trend.
Since it's been a strong week for Mitsui shareholders, let's have a look at trend of the longer term fundamentals.
View our latest analysis for Mitsui
To paraphrase Benjamin Graham: Over the short term the market is a voting machine, but over the long term it's a weighing machine. One imperfect but simple way to consider how the market perception of a company has shifted is to compare the change in the earnings per share (EPS) with the share price movement.
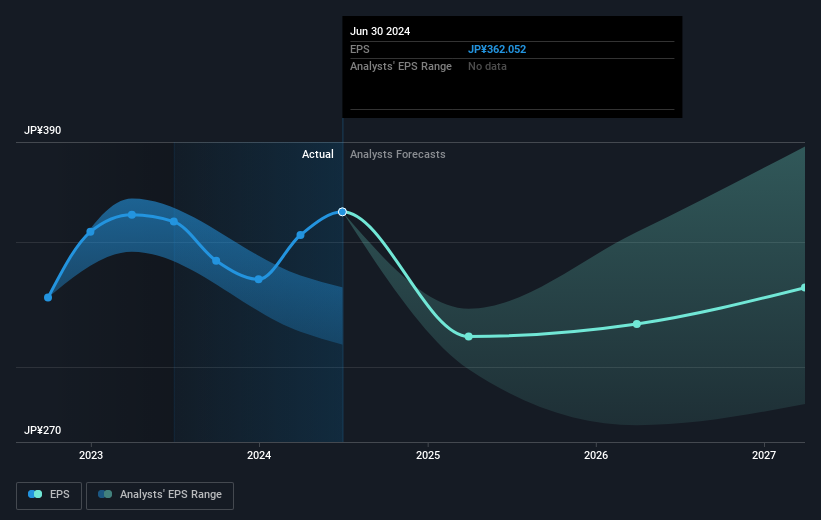
During five years of share price growth, Mitsui achieved compound earnings per share (EPS) growth of 25% per year. So the EPS growth rate is rather close to the annualized share price gain of 31% per year. Therefore one could conclude that sentiment towards the shares hasn't morphed very much. Rather, the share price has approximately tracked EPS growth.
The graphic below depicts how EPS has changed over time (unveil the exact values by clicking on the image).
We know that Mitsui has improved its bottom line over the last three years, but what does the future have in store? This free interactive report on Mitsui's balance sheet strength is a great place to start, if you want to investigate the stock further.
What About Dividends?
When looking at investment returns, it is important to consider the difference between total shareholder return (TSR) and share price return. The TSR is a return calculation that accounts for the value of cash dividends (assuming that any dividend received was reinvested) and the calculated value of any discounted capital raisings and spin-offs. It's fair to say that the TSR gives a more complete picture for stocks that pay a dividend. In the case of Mitsui, it has a TSR of 367% for the last 5 years. That exceeds its share price return that we previously mentioned. The dividends paid by the company have thusly boosted the total shareholder return.
A Different Perspective
Mitsui's TSR for the year was broadly in line with the market average, at 22%. It has to be noted that the recent return falls short of the 36% shareholders have gained each year, over half a decade. More recently, the share price growth has slowed. But it has to be said the overall picture is one of good long term and short term performance. Arguably that makes Mitsui a stock worth watching. While it is well worth considering the different impacts that market conditions can have on the share price, there are other factors that are even more important. Case in point: We've spotted 4 warning signs for Mitsui you should be aware of, and 2 of them shouldn't be ignored.
But note: Mitsui may not be the best stock to buy. So take a peek at this free list of interesting companies with past earnings growth (and further growth forecast).
Please note, the market returns quoted in this article reflect the market weighted average returns of stocks that currently trade on Japanese exchanges.
New: Manage All Your Stock Portfolios in One Place
We've created the ultimate portfolio companion for stock investors, and it's free.
• Connect an unlimited number of Portfolios and see your total in one currency
• Be alerted to new Warning Signs or Risks via email or mobile
• Track the Fair Value of your stocks
Have feedback on this article? Concerned about the content? Get in touch with us directly. Alternatively, email editorial-team (at) simplywallst.com.
This article by Simply Wall St is general in nature. We provide commentary based on historical data and analyst forecasts only using an unbiased methodology and our articles are not intended to be financial advice. It does not constitute a recommendation to buy or sell any stock, and does not take account of your objectives, or your financial situation. We aim to bring you long-term focused analysis driven by fundamental data. Note that our analysis may not factor in the latest price-sensitive company announcements or qualitative material. Simply Wall St has no position in any stocks mentioned.
About TSE:8031
Undervalued with adequate balance sheet and pays a dividend.
Similar Companies
Market Insights

Community Narratives
