
Advertisement
As global markets navigate a volatile landscape marked by AI competition concerns and fluctuating corporate earnings, investors are keeping a close eye on central bank policies and economic indicators. Amidst these dynamics, dividend stocks can offer stability and income potential, making them an appealing consideration for those looking to balance risk with steady returns.
Top 10 Dividend Stocks
| Name | Dividend Yield | Dividend Rating |
| Peoples Bancorp (NasdaqGS:PEBO) | 4.81% | ★★★★★★ |
| Daito Trust ConstructionLtd (TSE:1878) | 3.99% | ★★★★★★ |
| Citizens & Northern (NasdaqCM:CZNC) | 5.28% | ★★★★★★ |
| Southside Bancshares (NYSE:SBSI) | 4.48% | ★★★★★★ |
| GakkyushaLtd (TSE:9769) | 4.42% | ★★★★★★ |
| China South Publishing & Media Group (SHSE:601098) | 4.08% | ★★★★★★ |
| HUAYU Automotive Systems (SHSE:600741) | 4.45% | ★★★★★★ |
| Nihon Parkerizing (TSE:4095) | 3.96% | ★★★★★★ |
| FALCO HOLDINGS (TSE:4671) | 6.66% | ★★★★★★ |
| Yamato Kogyo (TSE:5444) | 3.88% | ★★★★★★ |
Click here to see the full list of 1959 stocks from our Top Dividend Stocks screener.
Here we highlight a subset of our preferred stocks from the screener.
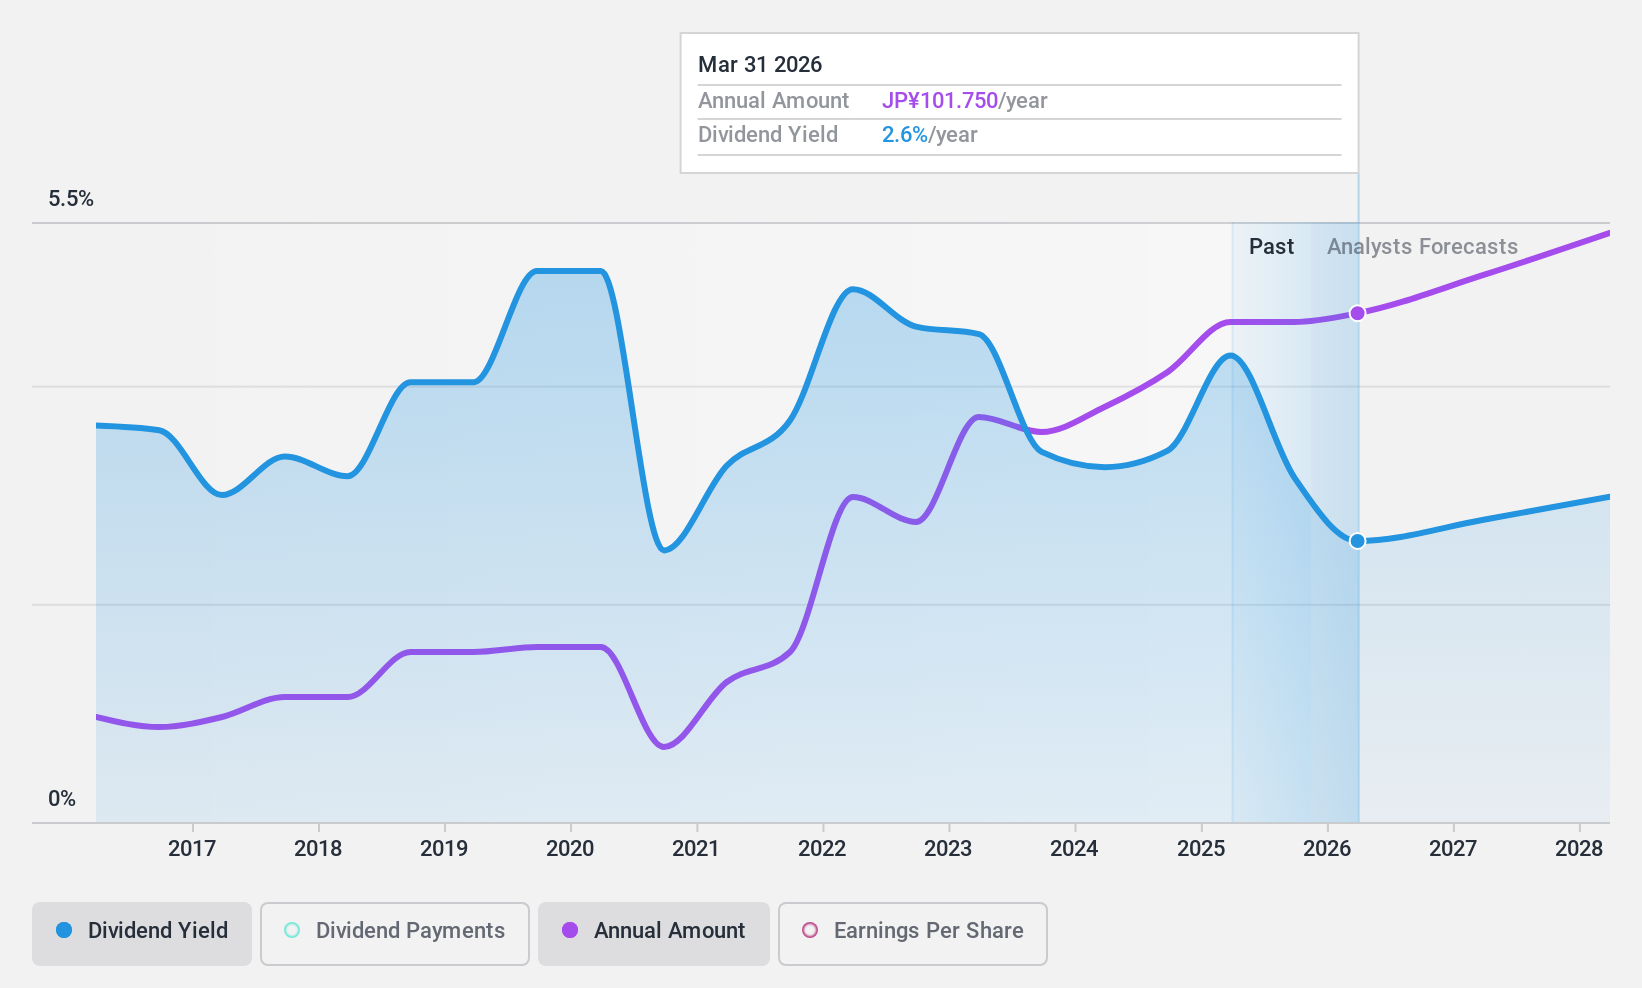
Marubeni (TSE:8002)
Simply Wall St Dividend Rating: ★★★★★☆
Overview: Marubeni Corporation engages in the purchasing, distribution, and marketing of industrial and consumer goods, with a market cap of ¥3.98 trillion.
Operations: Marubeni Corporation's revenue segments include Power (¥423.29 million), Energy (¥880.49 million), Food I (¥911.46 million), Food II (¥1.04 billion), Chemicals (¥595.96 million), Lifestyle (¥202.67 million), IT Solutions (¥395.42 million), Agri Business (¥1.40 billion), Forest Products (¥250.44 million), Aerospace & Ship (¥137.77 million), Infrastructure Project (¥33.05 million), Metals & Mineral Resources (¥598.95 million), Finance, Leasing & Real Estate Business (¥53.68 million) and Construction, Industrial Machinery & Mobility sectors contributing ¥572.61 million to its operations, along with Next Generation Corporate Development and Business Development segments at ¥25.39 and ¥23.34 millions respectively.
Dividend Yield: 4.2%
Marubeni's dividend payments are well-covered by earnings with a payout ratio of 28.1% and cash flows at 58.1%, indicating sustainability despite its historically volatile dividend track record. The company recently announced a ¥30 billion share repurchase program to enhance shareholder returns, reflecting a flexible capital policy. However, debt coverage by operating cash flow remains weak. Trading below the market average P/E ratio suggests good relative value, though dividend reliability has been inconsistent over the past decade.
- Click here and access our complete dividend analysis report to understand the dynamics of Marubeni.
- The valuation report we've compiled suggests that Marubeni's current price could be quite moderate.
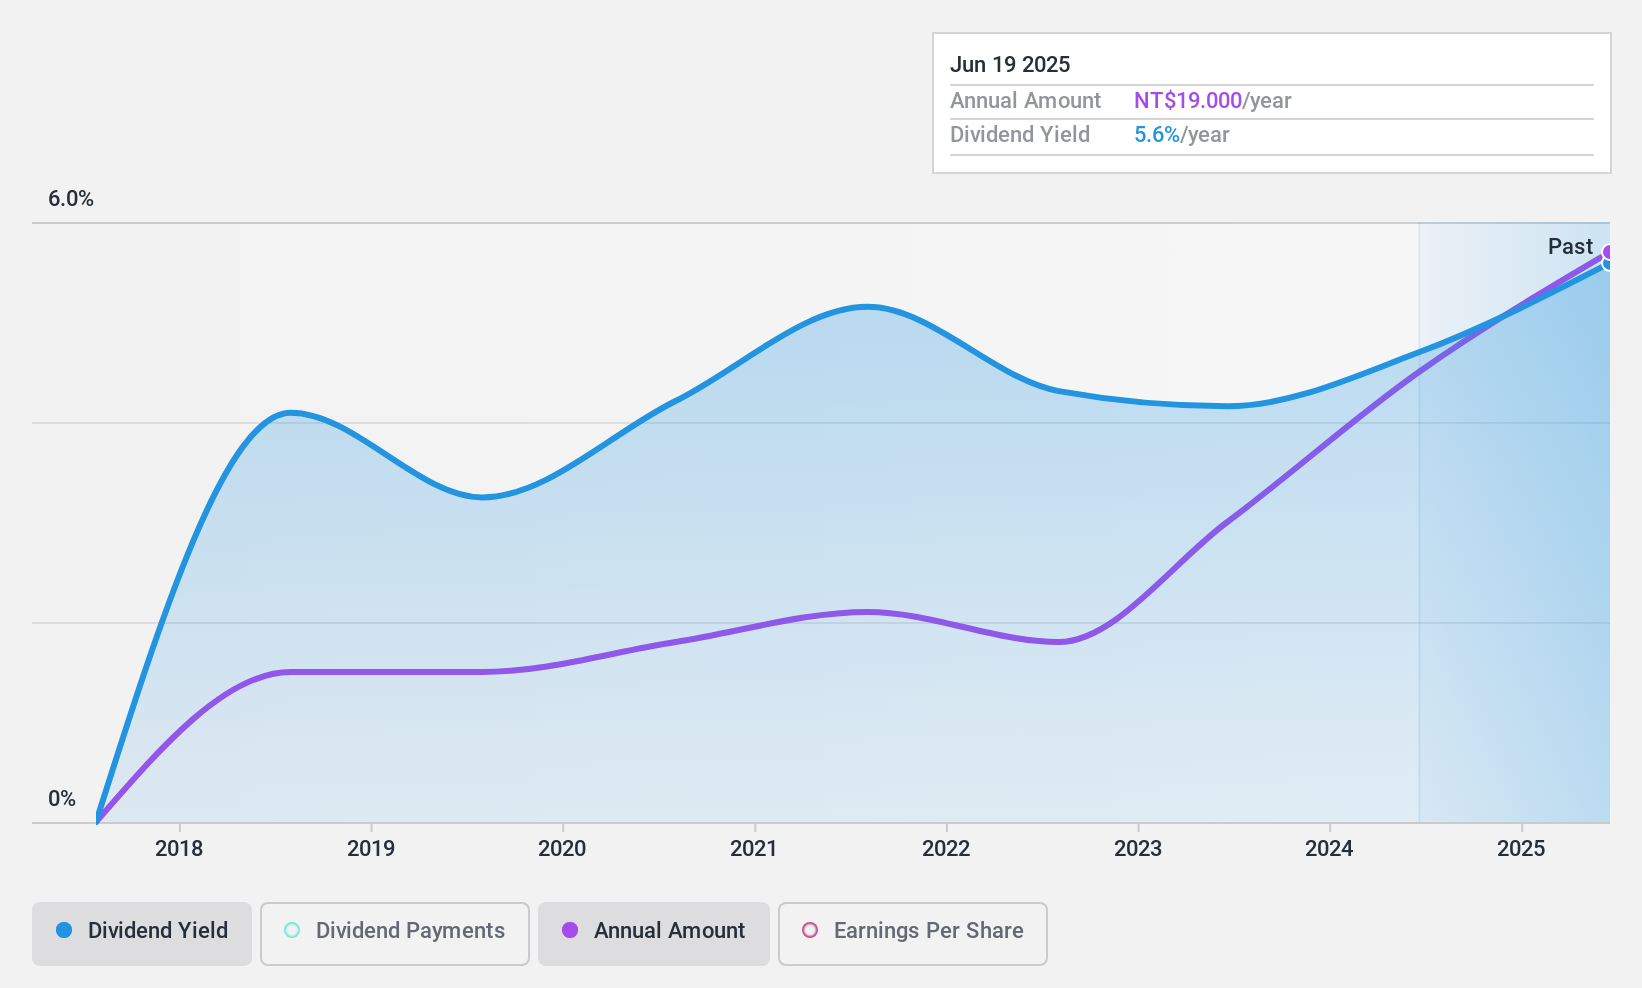
Nan Pao Resins Chemical (TWSE:4766)
Simply Wall St Dividend Rating: ★★★★☆☆
Overview: Nan Pao Resins Chemical Co., Ltd. operates in the manufacturing, wholesale, and retail of synthetic resins and plastics, adhesives, resin coatings, dyes, and pigments across various continents with a market cap of NT$40.27 billion.
Operations: Nan Pao Resins Chemical Co., Ltd. generates revenue from several regions, with NT$8.34 billion from Taiwan, NT$7.44 billion from Vietnam, NT$3.09 billion from Australia, and NT$7.68 billion from the Mainland Area, alongside contributions of NT$2.78 billion from other regions.
Dividend Yield: 4.5%
Nan Pao Resins Chemical's dividend payments, although stable and growing over the past seven years, are relatively new. The company's payout ratio of 68.1% indicates dividends are well-covered by earnings, while a cash payout ratio of 85.8% shows coverage by cash flows is adequate. Recent earnings growth supports dividend sustainability, with net income for Q3 2024 at TWD 660.57 million, up from TWD 644.54 million year-on-year, suggesting financial strength to maintain payouts.
- Click here to discover the nuances of Nan Pao Resins Chemical with our detailed analytical dividend report.
- Upon reviewing our latest valuation report, Nan Pao Resins Chemical's share price might be too pessimistic.
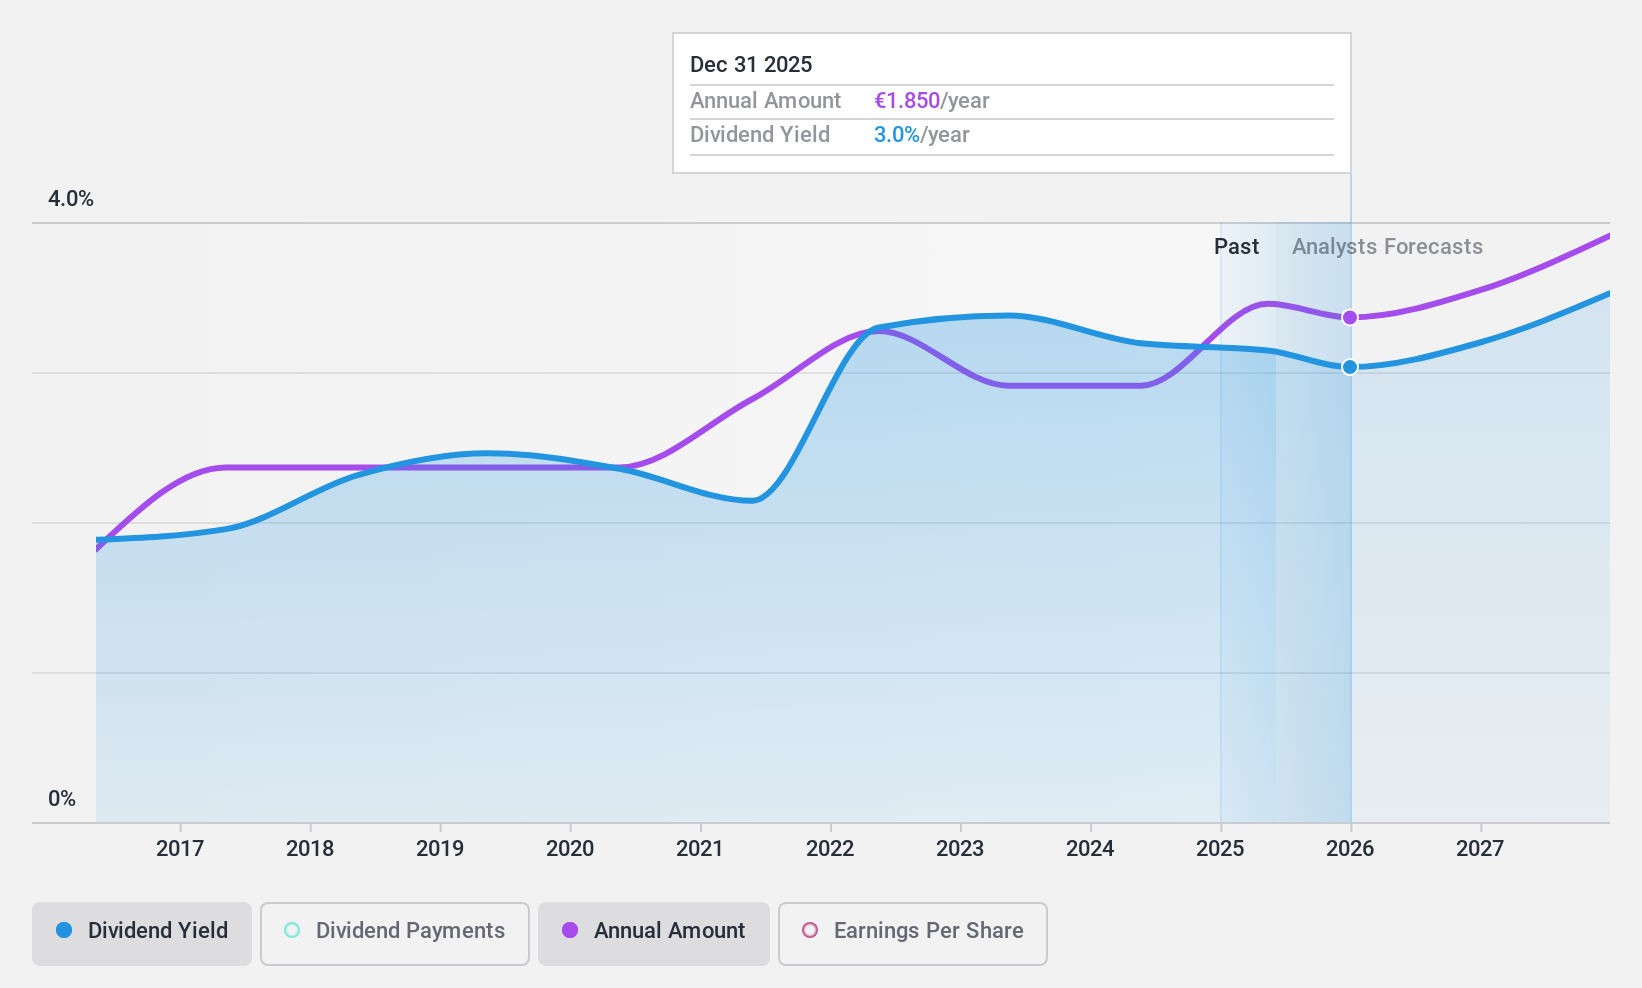
Uzin Utz (XTRA:UZU)
Simply Wall St Dividend Rating: ★★★★★☆
Overview: Uzin Utz SE develops, manufactures, and sells construction chemical system products in Germany, the United States, Netherlands, and internationally with a market cap of €248.18 million.
Operations: Uzin Utz SE's revenue is primarily derived from Germany - Laying Systems (€209.68 million), Western Europe (€81.64 million), Netherlands - Laying Systems (€83.59 million), USA - Laying Systems (€73.60 million), Netherlands - Wholesale (€33.66 million), Germany - Surface Care and Refinement (€34.21 million), South/Eastern Europe (€27.70 million), and Germany - Machinery and Tools (€31.94 million).
Dividend Yield: 3.2%
Uzin Utz's dividend payments are well-supported, with a low payout ratio of 33.8% and a cash payout ratio of 19.9%, ensuring sustainability from both earnings and cash flows. Over the past decade, dividends have been stable and growing, though the yield of 3.21% is below top-tier German dividend payers. Trading at a price-to-earnings ratio of 10.5x, Uzin Utz offers good relative value compared to the broader German market average of 16.7x.
- Delve into the full analysis dividend report here for a deeper understanding of Uzin Utz.
- Our valuation report here indicates Uzin Utz may be undervalued.
Seize The Opportunity
- Explore the 1959 names from our Top Dividend Stocks screener here.
- Got skin in the game with these stocks? Elevate how you manage them by using Simply Wall St's portfolio, where intuitive tools await to help optimize your investment outcomes.
- Invest smarter with the free Simply Wall St app providing detailed insights into every stock market around the globe.
Contemplating Other Strategies?
- Explore high-performing small cap companies that haven't yet garnered significant analyst attention.
- Fuel your portfolio with companies showing strong growth potential, backed by optimistic outlooks both from analysts and management.
- Find companies with promising cash flow potential yet trading below their fair value.
This article by Simply Wall St is general in nature. We provide commentary based on historical data and analyst forecasts only using an unbiased methodology and our articles are not intended to be financial advice. It does not constitute a recommendation to buy or sell any stock, and does not take account of your objectives, or your financial situation. We aim to bring you long-term focused analysis driven by fundamental data. Note that our analysis may not factor in the latest price-sensitive company announcements or qualitative material. Simply Wall St has no position in any stocks mentioned.
Valuation is complex, but we're here to simplify it.
Discover if Nan Pao Resins Chemical might be undervalued or overvalued with our detailed analysis, featuring fair value estimates, potential risks, dividends, insider trades, and its financial condition.
Access Free AnalysisHave feedback on this article? Concerned about the content? Get in touch with us directly. Alternatively, email editorial-team@simplywallst.com
About TWSE:4766
Nan Pao Resins Chemical
Engages in the manufacturing, wholesale, and retail sale of synthetic resins and plastics, adhesives, resin coatings, dyes, and pigments in Taiwan, rest of Asia, Oceania, Europe, Africa, and America.
Excellent balance sheet and fair value.
Similar Companies
Market Insights

Advertisement
Community Narratives
MicroVision will explode future revenue by 380.37% with a vision towards success
Fair Value US$60|98.4% undervalued
TH
Community Contributor
The Indispensable Artery for a New North American Economy
Fair Value CA$132.87|0.6% undervalued
TI
Community Contributor
Recently Updated Narratives
JO


JohnJ on Worldline ·
No miracle in sight
Fair Value:€7.0178.0% undervalued
8 followersusers have followed this narrative
0 commentsusers have commented on this narrative
0 likesusers have liked this narrative
MA


MarkoVT on COVER ·
Q3 Outlook modestly optimistic
Fair Value:JP¥1.65k2.0% overvalued
1 followerusers have followed this narrative
0 commentsusers have commented on this narrative
0 likesusers have liked this narrative
BL


BlackGoat on Alphabet ·
Alphabet: The Under-appreciated Compounder Hiding in Plain Sight
Fair Value:US$324.481.3% undervalued
80 followersusers have followed this narrative
3 commentsusers have commented on this narrative
1 likeusers have liked this narrative
Popular Narratives
OS

oscargarcia on Alphabet ·
The company that turned a verb into a global necessity and basically runs the modern internet, digital ads, smartphones, maps, and AI.
Fair Value:US$3405.9% undervalued
136 followersusers have followed this narrative
6 commentsusers have commented on this narrative
18 likesusers have liked this narrative
TH

TheWallstreetKing on MicroVision ·
MicroVision will explode future revenue by 380.37% with a vision towards success
Fair Value:US$6098.4% undervalued
90 followersusers have followed this narrative
10 commentsusers have commented on this narrative
18 likesusers have liked this narrative
AN


AnalystConsensusTarget on NVIDIA ·
NVDA: Expanding AI Demand Will Drive Major Data Center Investments Through 2026
Fair Value:US$232.7922.6% undervalued
928 followersusers have followed this narrative
6 commentsusers have commented on this narrative
22 likesusers have liked this narrative