
Advertisement
- Japan
- /
- Electrical
- /
- TSE:6955
FDK Corporation's (TSE:6955) 35% Cheaper Price Remains In Tune With Revenues

FDK Corporation (TSE:6955) shareholders won't be pleased to see that the share price has had a very rough month, dropping 35% and undoing the prior period's positive performance. The drop over the last 30 days has capped off a tough year for shareholders, with the share price down 34% in that time.
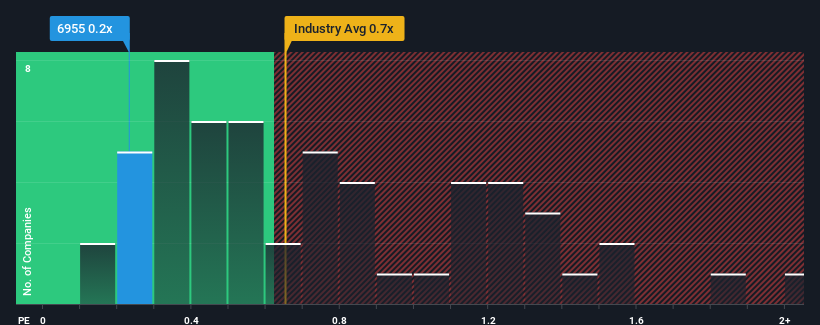
Although its price has dipped substantially, there still wouldn't be many who think FDK's price-to-sales (or "P/S") ratio of 0.2x is worth a mention when the median P/S in Japan's Electrical industry is similar at about 0.7x. While this might not raise any eyebrows, if the P/S ratio is not justified investors could be missing out on a potential opportunity or ignoring looming disappointment.
See our latest analysis for FDK
What Does FDK's Recent Performance Look Like?
FDK has been doing a decent job lately as it's been growing revenue at a reasonable pace. It might be that many expect the respectable revenue performance to only match most other companies over the coming period, which has kept the P/S from rising. If you like the company, you'd be hoping this isn't the case so that you could potentially pick up some stock while it's not quite in favour.
Although there are no analyst estimates available for FDK, take a look at this free data-rich visualisation to see how the company stacks up on earnings, revenue and cash flow.How Is FDK's Revenue Growth Trending?
There's an inherent assumption that a company should be matching the industry for P/S ratios like FDK's to be considered reasonable.
Retrospectively, the last year delivered a decent 4.9% gain to the company's revenues. The solid recent performance means it was also able to grow revenue by 5.0% in total over the last three years. Therefore, it's fair to say the revenue growth recently has been respectable for the company.
Weighing that recent medium-term revenue trajectory against the broader industry's one-year forecast for expansion of 3.3% shows it's about the same on an annualised basis.
In light of this, it's understandable that FDK's P/S sits in line with the majority of other companies. It seems most investors are expecting to see average growth rates continue into the future and are only willing to pay a moderate amount for the stock.
The Bottom Line On FDK's P/S
FDK's plummeting stock price has brought its P/S back to a similar region as the rest of the industry. Typically, we'd caution against reading too much into price-to-sales ratios when settling on investment decisions, though it can reveal plenty about what other market participants think about the company.
It appears to us that FDK maintains its moderate P/S off the back of its recent three-year growth being in line with the wider industry forecast. Currently, with a past revenue trend that aligns closely wit the industry outlook, shareholders are confident the company's future revenue outlook won't contain any major surprises. If recent medium-term revenue trends continue, it's hard to see the share price moving strongly in either direction in the near future under these circumstances.
Before you settle on your opinion, we've discovered 4 warning signs for FDK (1 is significant!) that you should be aware of.
It's important to make sure you look for a great company, not just the first idea you come across. So if growing profitability aligns with your idea of a great company, take a peek at this free list of interesting companies with strong recent earnings growth (and a low P/E).
New: AI Stock Screener & Alerts
Our new AI Stock Screener scans the market every day to uncover opportunities.
• Dividend Powerhouses (3%+ Yield)
• Undervalued Small Caps with Insider Buying
• High growth Tech and AI Companies
Or build your own from over 50 metrics.
Have feedback on this article? Concerned about the content? Get in touch with us directly. Alternatively, email editorial-team (at) simplywallst.com.
This article by Simply Wall St is general in nature. We provide commentary based on historical data and analyst forecasts only using an unbiased methodology and our articles are not intended to be financial advice. It does not constitute a recommendation to buy or sell any stock, and does not take account of your objectives, or your financial situation. We aim to bring you long-term focused analysis driven by fundamental data. Note that our analysis may not factor in the latest price-sensitive company announcements or qualitative material. Simply Wall St has no position in any stocks mentioned.
About TSE:6955
FDK
Manufactures and sells batteries, rechargeable batteries, battery devices, and electronic components and devices in Japan.
Excellent balance sheet with proven track record.
Similar Companies
Market Insights

Advertisement
Community Narratives
WhiteCap Is Positioned To Profit Regardless Of Trump's Policy 
Fair Value CA$22.60|61.6% undervalued
ST
Equity Analyst and Writer
Microsoft's Evolution Will Drive Revenue to New Heights Fueled by AI
Fair Value US$360.00|28.3% overvalued
BR
Community Contributor
A CASE FOR USD$2.50 (CAD$3.44) BY 2028 (A 5-10 BAGGER)
Fair Value CA$3.44|87.8% undervalued
AG
Community Contributor