
Advertisement
Some say volatility, rather than debt, is the best way to think about risk as an investor, but Warren Buffett famously said that 'Volatility is far from synonymous with risk.' It's only natural to consider a company's balance sheet when you examine how risky it is, since debt is often involved when a business collapses. We note that Nidec Corporation (TSE:6594) does have debt on its balance sheet. But should shareholders be worried about its use of debt?
When Is Debt Dangerous?
Debt assists a business until the business has trouble paying it off, either with new capital or with free cash flow. If things get really bad, the lenders can take control of the business. However, a more common (but still painful) scenario is that it has to raise new equity capital at a low price, thus permanently diluting shareholders. Of course, plenty of companies use debt to fund growth, without any negative consequences. When we examine debt levels, we first consider both cash and debt levels, together.
See our latest analysis for Nidec
What Is Nidec's Debt?
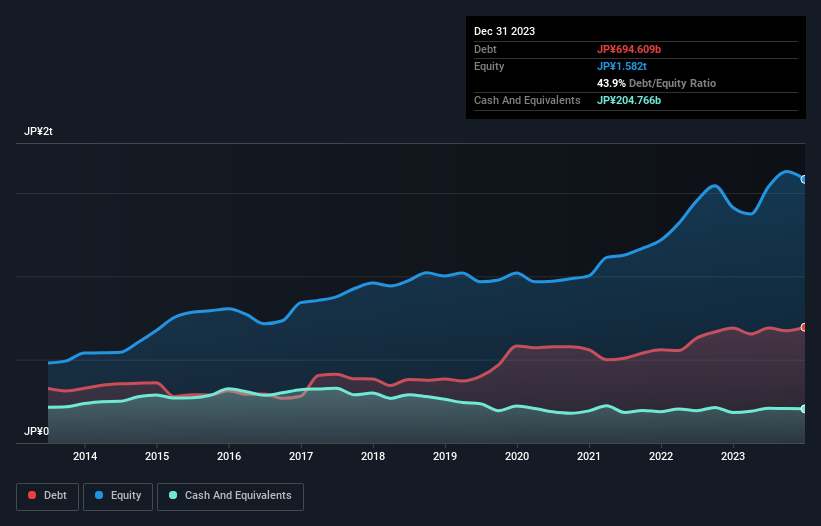
As you can see below, Nidec had JP¥694.6b of debt, at December 2023, which is about the same as the year before. You can click the chart for greater detail. However, it does have JP¥204.8b in cash offsetting this, leading to net debt of about JP¥489.8b.
How Strong Is Nidec's Balance Sheet?
The latest balance sheet data shows that Nidec had liabilities of JP¥982.2b due within a year, and liabilities of JP¥543.6b falling due after that. Offsetting these obligations, it had cash of JP¥204.8b as well as receivables valued at JP¥659.6b due within 12 months. So its liabilities outweigh the sum of its cash and (near-term) receivables by JP¥661.4b.
Given Nidec has a humongous market capitalization of JP¥3.79t, it's hard to believe these liabilities pose much threat. However, we do think it is worth keeping an eye on its balance sheet strength, as it may change over time.
We measure a company's debt load relative to its earnings power by looking at its net debt divided by its earnings before interest, tax, depreciation, and amortization (EBITDA) and by calculating how easily its earnings before interest and tax (EBIT) cover its interest expense (interest cover). The advantage of this approach is that we take into account both the absolute quantum of debt (with net debt to EBITDA) and the actual interest expenses associated with that debt (with its interest cover ratio).
Nidec's net debt to EBITDA ratio of about 1.8 suggests only moderate use of debt. And its commanding EBIT of 1k times its interest expense, implies the debt load is as light as a peacock feather. Unfortunately, Nidec's EBIT flopped 11% over the last four quarters. If that sort of decline is not arrested, then the managing its debt will be harder than selling broccoli flavoured ice-cream for a premium. The balance sheet is clearly the area to focus on when you are analysing debt. But it is future earnings, more than anything, that will determine Nidec's ability to maintain a healthy balance sheet going forward. So if you want to see what the professionals think, you might find this free report on analyst profit forecasts to be interesting.
Finally, a business needs free cash flow to pay off debt; accounting profits just don't cut it. So the logical step is to look at the proportion of that EBIT that is matched by actual free cash flow. Looking at the most recent three years, Nidec recorded free cash flow of 26% of its EBIT, which is weaker than we'd expect. That weak cash conversion makes it more difficult to handle indebtedness.
Our View
Nidec's EBIT growth rate and conversion of EBIT to free cash flow definitely weigh on it, in our esteem. But its interest cover tells a very different story, and suggests some resilience. We think that Nidec's debt does make it a bit risky, after considering the aforementioned data points together. Not all risk is bad, as it can boost share price returns if it pays off, but this debt risk is worth keeping in mind. The balance sheet is clearly the area to focus on when you are analysing debt. However, not all investment risk resides within the balance sheet - far from it. For instance, we've identified 1 warning sign for Nidec that you should be aware of.
If, after all that, you're more interested in a fast growing company with a rock-solid balance sheet, then check out our list of net cash growth stocks without delay.
Valuation is complex, but we're here to simplify it.
Discover if Nidec might be undervalued or overvalued with our detailed analysis, featuring fair value estimates, potential risks, dividends, insider trades, and its financial condition.
Access Free AnalysisHave feedback on this article? Concerned about the content? Get in touch with us directly. Alternatively, email editorial-team (at) simplywallst.com.
This article by Simply Wall St is general in nature. We provide commentary based on historical data and analyst forecasts only using an unbiased methodology and our articles are not intended to be financial advice. It does not constitute a recommendation to buy or sell any stock, and does not take account of your objectives, or your financial situation. We aim to bring you long-term focused analysis driven by fundamental data. Note that our analysis may not factor in the latest price-sensitive company announcements or qualitative material. Simply Wall St has no position in any stocks mentioned.
About TSE:6594
Nidec
Develops, manufactures, and sells motors, electronics and optical components, and other related products in Japan and internationally.
Flawless balance sheet with solid track record and pays a dividend.
Similar Companies
Market Insights

Advertisement
Community Narratives
Quality at a Premium. A time to watch, not to buy?
Fair Value US$154.56|29.9% undervalued
DA
Community Contributor
GRAB: The Super-App at the Heart of Southeast Asia’s Digital Boom
Fair Value US$8.20|22.9% undervalued
BL
Community Contributor
Verve Group to Surge with 51.61% Revenue Growth
Fair Value €6.00|64.1% undervalued
ME
Community Contributor