
Advertisement

Legendary fund manager Li Lu (who Charlie Munger backed) once said, 'The biggest investment risk is not the volatility of prices, but whether you will suffer a permanent loss of capital.' It's only natural to consider a company's balance sheet when you examine how risky it is, since debt is often involved when a business collapses. We note that Nidec Corporation (TSE:6594) does have debt on its balance sheet. But is this debt a concern to shareholders?
What Risk Does Debt Bring?
Debt and other liabilities become risky for a business when it cannot easily fulfill those obligations, either with free cash flow or by raising capital at an attractive price. Part and parcel of capitalism is the process of 'creative destruction' where failed businesses are mercilessly liquidated by their bankers. However, a more usual (but still expensive) situation is where a company must dilute shareholders at a cheap share price simply to get debt under control. Of course, plenty of companies use debt to fund growth, without any negative consequences. The first step when considering a company's debt levels is to consider its cash and debt together.
See our latest analysis for Nidec
How Much Debt Does Nidec Carry?
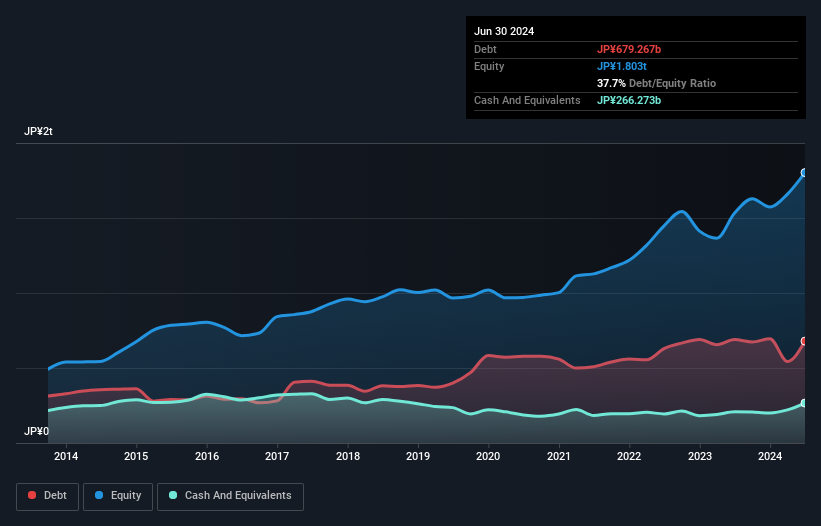
As you can see below, Nidec had JP¥679.3b of debt, at June 2024, which is about the same as the year before. You can click the chart for greater detail. On the flip side, it has JP¥266.3b in cash leading to net debt of about JP¥413.0b.
A Look At Nidec's Liabilities
The latest balance sheet data shows that Nidec had liabilities of JP¥981.6b due within a year, and liabilities of JP¥675.0b falling due after that. Offsetting this, it had JP¥266.3b in cash and JP¥734.3b in receivables that were due within 12 months. So its liabilities total JP¥656.0b more than the combination of its cash and short-term receivables.
Given Nidec has a humongous market capitalization of JP¥3.52t, it's hard to believe these liabilities pose much threat. Having said that, it's clear that we should continue to monitor its balance sheet, lest it change for the worse.
We measure a company's debt load relative to its earnings power by looking at its net debt divided by its earnings before interest, tax, depreciation, and amortization (EBITDA) and by calculating how easily its earnings before interest and tax (EBIT) cover its interest expense (interest cover). The advantage of this approach is that we take into account both the absolute quantum of debt (with net debt to EBITDA) and the actual interest expenses associated with that debt (with its interest cover ratio).
Nidec has net debt of just 1.4 times EBITDA, suggesting it could ramp leverage without breaking a sweat. But the really cool thing is that it actually managed to receive more interest than it paid, over the last year. So there's no doubt this company can take on debt while staying cool as a cucumber. In addition to that, we're happy to report that Nidec has boosted its EBIT by 46%, thus reducing the spectre of future debt repayments. When analysing debt levels, the balance sheet is the obvious place to start. But ultimately the future profitability of the business will decide if Nidec can strengthen its balance sheet over time. So if you want to see what the professionals think, you might find this free report on analyst profit forecasts to be interesting.
Finally, a business needs free cash flow to pay off debt; accounting profits just don't cut it. So we clearly need to look at whether that EBIT is leading to corresponding free cash flow. In the last three years, Nidec's free cash flow amounted to 41% of its EBIT, less than we'd expect. That's not great, when it comes to paying down debt.
Our View
The good news is that Nidec's demonstrated ability to cover its interest expense with its EBIT delights us like a fluffy puppy does a toddler. And that's just the beginning of the good news since its EBIT growth rate is also very heartening. When we consider the range of factors above, it looks like Nidec is pretty sensible with its use of debt. While that brings some risk, it can also enhance returns for shareholders. Over time, share prices tend to follow earnings per share, so if you're interested in Nidec, you may well want to click here to check an interactive graph of its earnings per share history.
When all is said and done, sometimes its easier to focus on companies that don't even need debt. Readers can access a list of growth stocks with zero net debt 100% free, right now.
Valuation is complex, but we're here to simplify it.
Discover if Nidec might be undervalued or overvalued with our detailed analysis, featuring fair value estimates, potential risks, dividends, insider trades, and its financial condition.
Access Free AnalysisHave feedback on this article? Concerned about the content? Get in touch with us directly. Alternatively, email editorial-team (at) simplywallst.com.
This article by Simply Wall St is general in nature. We provide commentary based on historical data and analyst forecasts only using an unbiased methodology and our articles are not intended to be financial advice. It does not constitute a recommendation to buy or sell any stock, and does not take account of your objectives, or your financial situation. We aim to bring you long-term focused analysis driven by fundamental data. Note that our analysis may not factor in the latest price-sensitive company announcements or qualitative material. Simply Wall St has no position in any stocks mentioned.
About TSE:6594
Nidec
Develops, manufactures, and sells motors, electronics and optical components, and other related products in Japan and internationally.
Flawless balance sheet with solid track record and pays a dividend.
Similar Companies
Market Insights

Advertisement
Community Narratives

Apple: A Dying Star with an Overpriced Valuation
Fair Value US$177.34|20.1% overvalued
IN
Community Contributor
Avino a case for USD$20 per share within 5 years (assuming $3,500 gold, $100 silver and $4 copper).
Fair Value CA$26.79|87.5% undervalued
AG
Community Contributor
Riding the Defense Boom RENK Sees Revenue Climb at 15% CAGR by FY 2029
Fair Value €69.87|20.5% undervalued
CH
Community Contributor